


This guide dives deep into Recruitment Reporting and Predictive Analytics, showcasing how these tools can be seamlessly integrated into the recruitment workflow to enhance hiring outcomes.
What will you learn by the end of this guide? 🎓
- The different types of Recruitment Reporting & Predictive Analytics.
- How to embed these tools into your recruitment process.
- The benefits of leveraging data-driven insights for strategic hiring.
Why is it important? 🌟
In the modern recruitment landscape, data is power.
By harnessing Recruitment Reporting and Predictive Analytics, recruiters can transform their approach, making informed decisions that position them as strategic hiring partners.
Here’s the step by step to do it 🚀
Before diving in, determine which data points are most relevant to your hiring goals. This could include candidate feedback, source effectiveness, or interview-to-offer ratios.
1. Types of Recruitment Reporting

| Category | Metric Name | Formula | What it’s for |
|---|---|---|---|
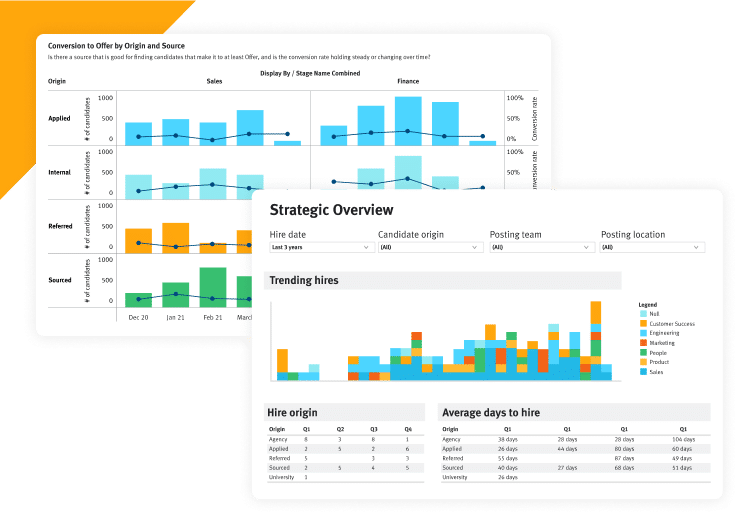
| Performance Metrics | Time-to-Hire | Date of Hire – Date of Job Posting | Duration to fill a position. |
| Cost-per-Hire | Total Recruitment Costs / Total Hires | Expense to acquire one hire. | |
| Source of Hire | (Number of Hires from Source X / Total Hires) x 100 | Origin of successful job candidates. | |
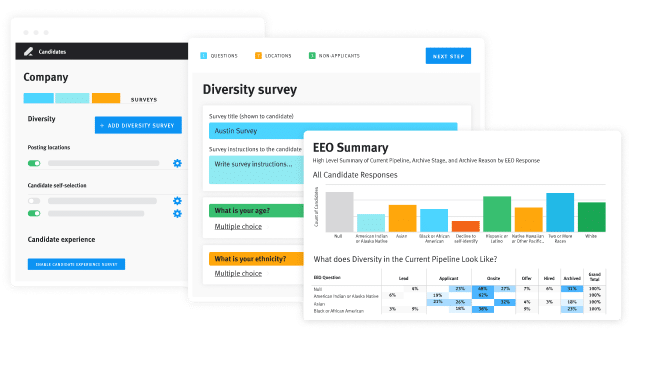
| Diversity & Inclusion | Gender Diversity | (Number of Gender X Employees / Total Employees) x 100 | Percentage of specific gender representation. |
| Ethnic Diversity | (Number of Ethnic Group Y Employees / Total Employees) x 100 | Percentage of specific ethnicity representation. | |
| Candidate Experience | Feedback Score | Total Feedback Points / Number of Feedbacks Received | Average candidate experience rating. |
| Net Promoter Score (NPS) | % of Promoters – % of Detractors | Measure of candidate loyalty potential. |
2. Types of Predictive Analytics
| Category | Metric Name | Formula | What it’s for |
|---|---|---|---|
| Turnover Predictions | Role-based Turnover | (Number of exits in Role X / Total employees in Role X) x 100 | Focus on role-specific retention. |
| Department-based Turnover | (Number of exits in Department Y / Total employees in Department Y) x 100 | Strengthen departmental retention strategies. | |
| Candidate Success Predictions | Role Success Rate | (Number of successful candidates in Role Z / Total candidates for Role Z) x 100 | Refine hiring for role success. |
| Talent Shortage Forecasts | Industry Talent Demand | Analyze growth rate of job postings vs. available talent in the industry | Prioritize industry-specific talent sourcing. |
| Role-specific Talent Demand | (Number of job postings for Role W / Available talent for Role W) x 100 | Target role-specific talent pools. |
3. Analyse The Data
Once you’ve gathered data, take the time to analyze it. Look for patterns, trends, and anomalies. This step is crucial in transforming raw data into actionable insights.
Suppose you’ve been facing challenges in hiring software developers. By leveraging Predictive Analytics, you identify that candidates from certain universities tend to stay longer and perform better. Armed with this insight, you can focus your campus recruitment efforts on these universities, leading to better hires and reduced turnover.
4. Create ‘What If’ Scenarios
Based on your predictions, create ‘what if’ scenarios. For instance, if there’s a forecasted spike in hiring needs, is it for a specific role, department, or across the board? Is it a short-term spike or a long-term trend?
Scenario Creation Sample
- Scenario A: What if the spike is 10% more than predicted?
- Scenario B: What if the spike is 10% less than predicted?
- Scenario C: What if the spike is prolonged over several months?
Next Course of Action
Scenario A: What if the spike is 10% more than predicted?
- Increase the budget for job ads and broaden the search on multiple platforms.
- Reach out to potential candidates who might not be actively looking but are a good fit.
- To accommodate the increased volume, consider group interviews or assessment centers.
Scenario B: What if the spike is 10% less than predicted?
- Ensure they are clear, engaging, and highlight the benefits of the role and company.
- A lesser spike might indicate competition; make your company stand out.
- Engage with candidates to understand any potential barriers or concerns.
Scenario C: What if the spike is prolonged over several months?
- Engage with potential candidates and keep them warm for future roles.
- For sustained hiring, partnerships with universities or training centers can be beneficial.
- Consider upskilling current employees to fill future roles.
After implementing strategies based on “what if” scenarios, continuously monitor their effectiveness. Adjust and iterate based on real-time data and feedback.
Next steps 🚶♂️
- Leverage your built-in ATS features or AI Platforms like Affinix and Koru to streamline recruitment reporting and predictive analytics.
- Keep your data clean to ensure you’re extracting and interpreting insights correctly.
- Stay updated with the latest trends, tools, and best practices.
Further resources 📚:
- 📌 Data analytics in recruitment: How to get started with and apply predictive analytics
- 📌 Predictive Analytics: A Talent Acquisition Tool | PeopleScout
- 📌 How Recruiters Can Use Predictive Analytics To Improve Hiring
- 📌 Predictive Hiring: The Key To Talent Acquisition Success eBook 2020
- 📌 IBM – The business case for AI in HR: Insights and tips on getting started