Pi Datametrics is a software tool that provides companies with valuable insights into their market landscape. It does this by tracking a company's visibility in the search landscape, as well as its competitor's performance.
Additionally, the software includes a keyword research function and a SERP analysis function. These two functions are extremely helpful for companies who want to do market intelligence, as they allow them to see which keywords their competitors are targeting and how well their website is appearing in Google's search results.
One of the things that makes Pi Datametrics unique is its predictive modeling capability. This feature allows companies to make predictions about future events by looking at past data and trends. In addition, it can help decision-makers understand why certain events happened in the past.
Predictive modeling can be extremely helpful for companies that want to do market intelligence, as it can help them understand what is likely to happen in the future and why particular events have happened in the past.
Another thing that sets Pi Datametrics apart from other market intelligence software tools is its Share of Voice metrics. This metric shows what percentage of total searches are for a particular keyword. It's a way to measure how much mindshare or market share a company has in the search landscape. Basically, it's a way to see how visible you are in comparison to your competition.
In addition to showing you how much overall visibility you have, Share of Voice also breaks down your visibility by organic and paid results, as well as by desktop and mobile searches. This is important because it allows you to see where your strengths and weaknesses are.
The best way to use Pi Datametrics is to combine its various features to get a comprehensive view of your market landscape. For example, you can use the Share of Voice metric to understand your overall visibility, the predictive modeling capability to understand what might happen in the future, and the SERP analysis function to see how well your website is appearing in Google's search results. By using all of these features together, you can get a complete picture of your market landscape and make better decisions about your marketing strategy.
The downfalls of this tool are first, its predictive modeling capability. While it can be helpful to use predictions about future events to make better decisions, there are often many factors that can affect an event, making it difficult to identify which ones are most important. Additionally, the software only shows how a website is appearing at a specific moment in time rather than over time.
Second, the Share of Voice is not just a static number. It's constantly changing, which means you need to be monitoring it on an ongoing basis. This can be difficult and may require hiring someone specifically for the task if you don't have the bandwidth internally. Plus, Share of Voice also shows you how your visibility has changed over time, which is useful for tracking progress and understanding what's working and what's not.
Finally, the pricing of Pi Datametrics can be a deterrent for some companies. The starting price for a monthly subscription is $1000/month, which may be too expensive for some small businesses. However, it's important to keep in mind that the software includes a lot of valuable features that can save you time and money in the long run.
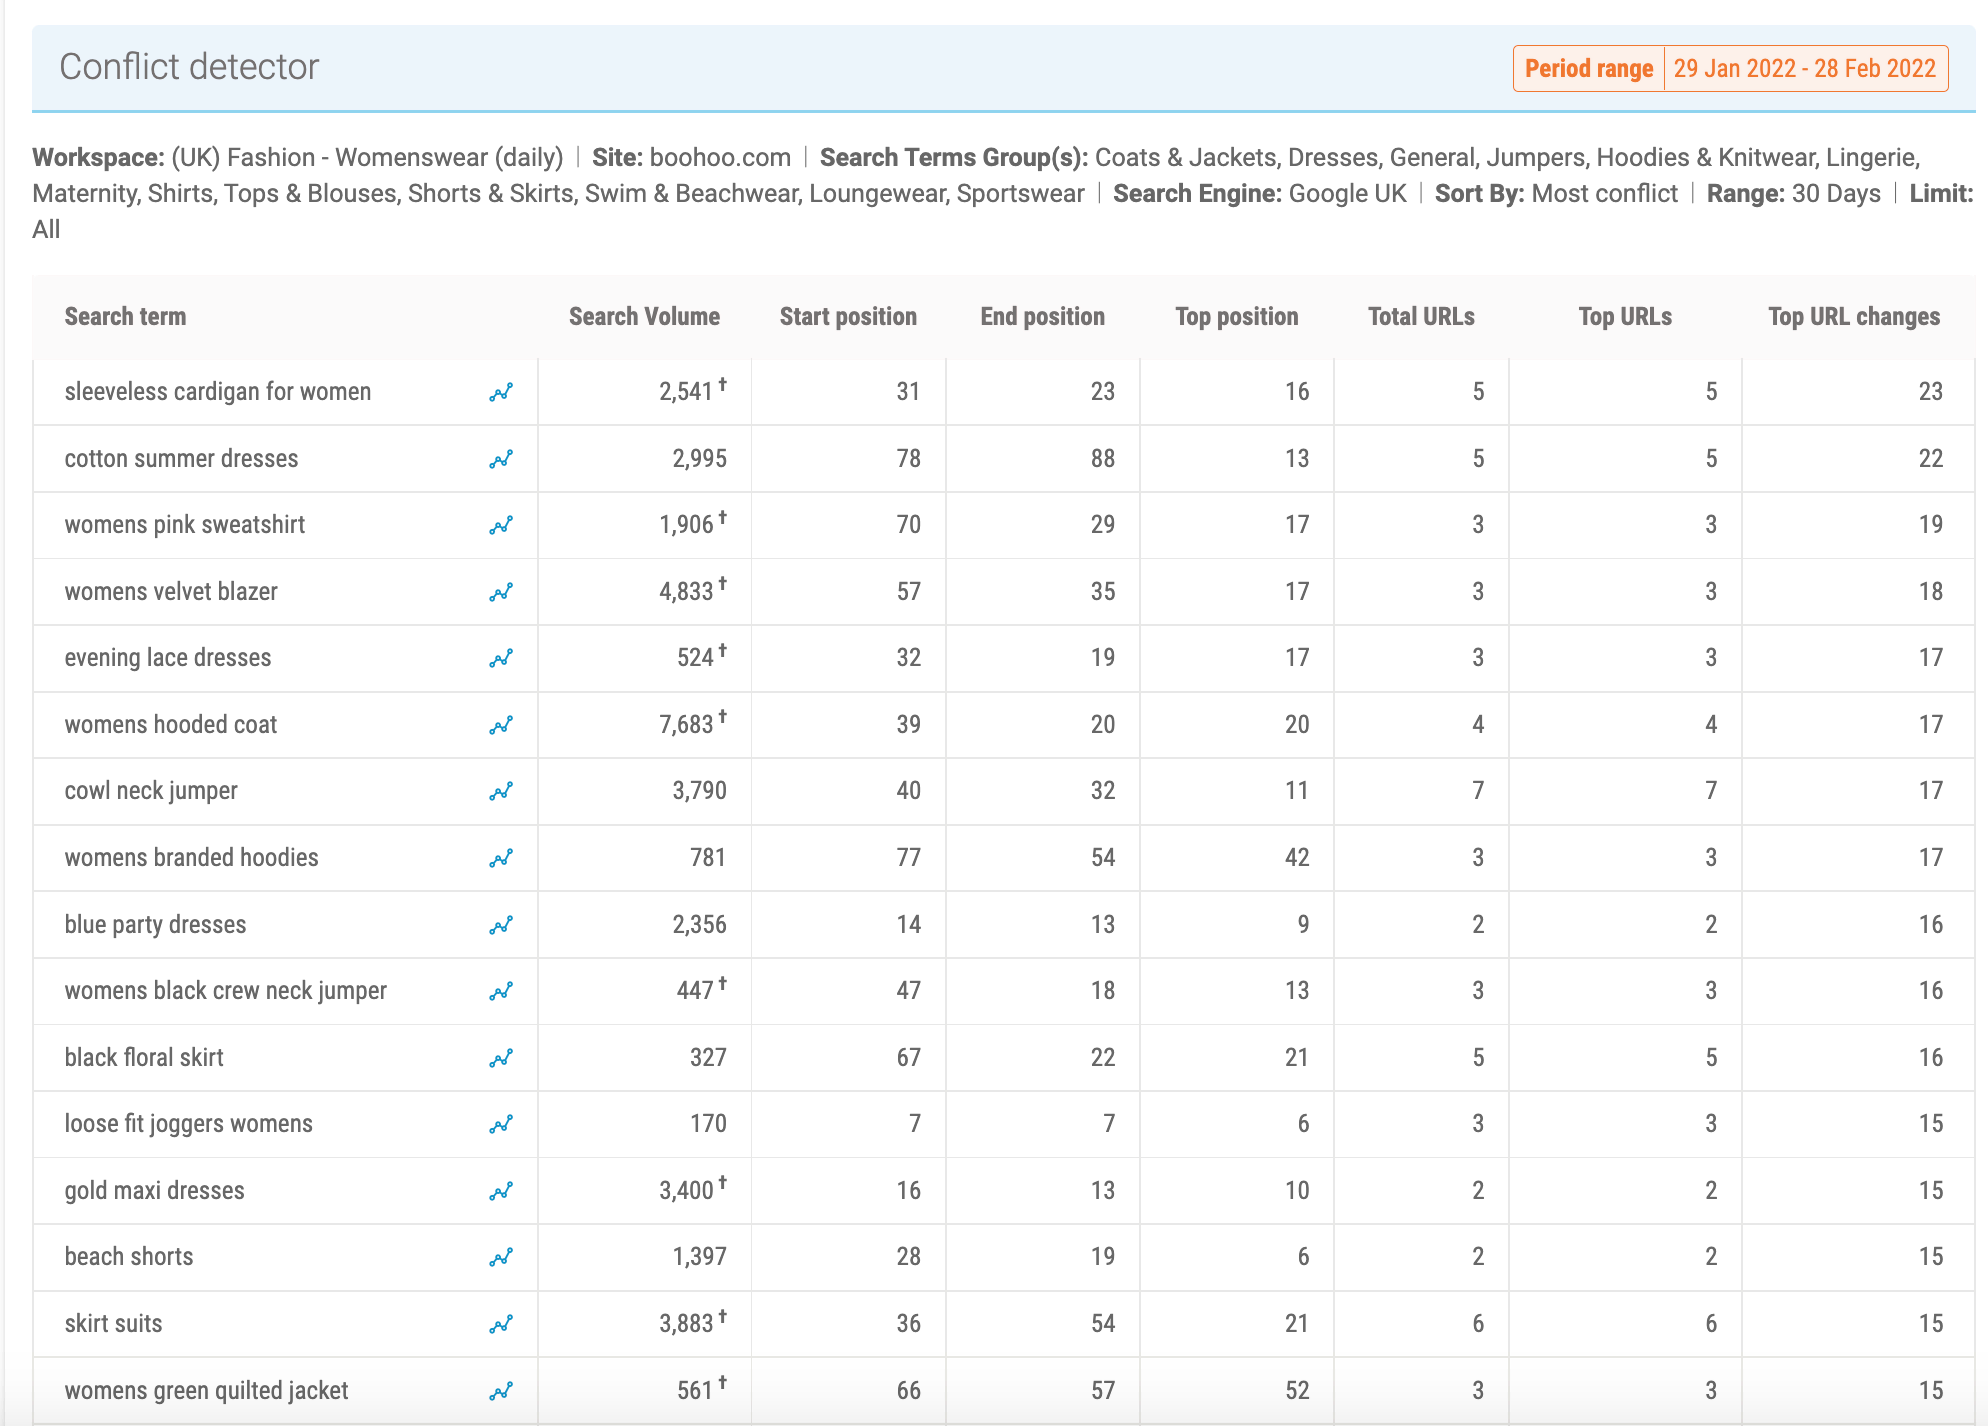 Detect conflicts as soon as they come AND monitor the keywords everyone searches for with Pi Datametrics.
Conclusion
Compared to alternatives like SEMrush, Pi Datametrics is more expensive. However, it should be noted that Pi Datametrics does offer a free trial and does not require you to get a quote for pricing as SEMrush does.
Pi Datametrics ranks #38 on our list because it's a software tool that provides companies with valuable insights into their market landscape. It tracks a company's visibility in the search landscape, as well as its competitor's performance which makes it helpful for companies who want to do market intelligence.
Additionally, the software includes other features such as keyword research and SERP analysis which can be very useful for businesses trying to improve their ranking in Google searches. Although the starting price for a monthly subscription is $1,000/month, the software could save time and money in the long run due to all of its features

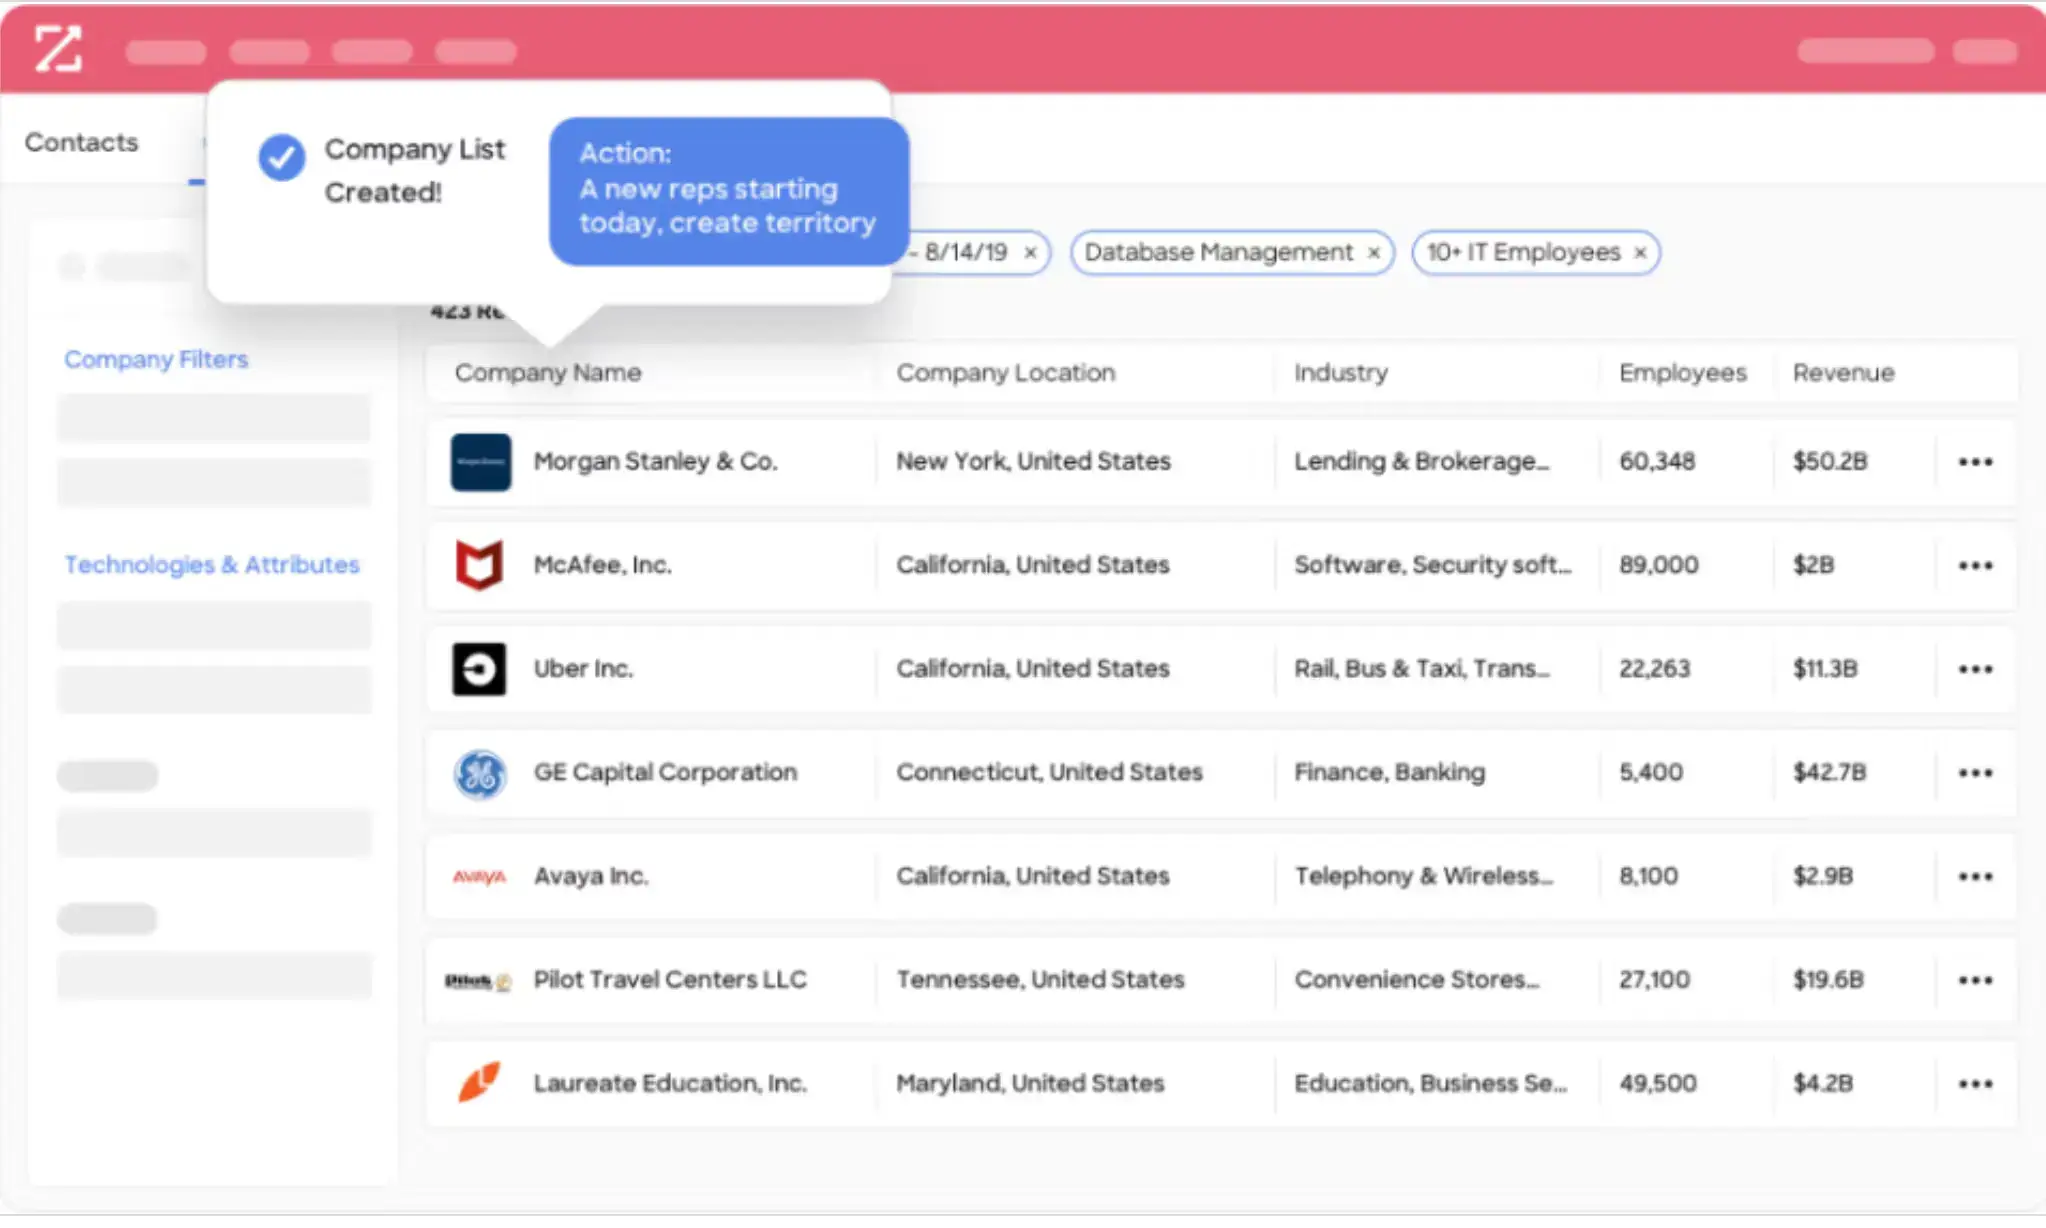 Create lists, monitor rivals, and easily search companies with ZoomInfo SalesOS.
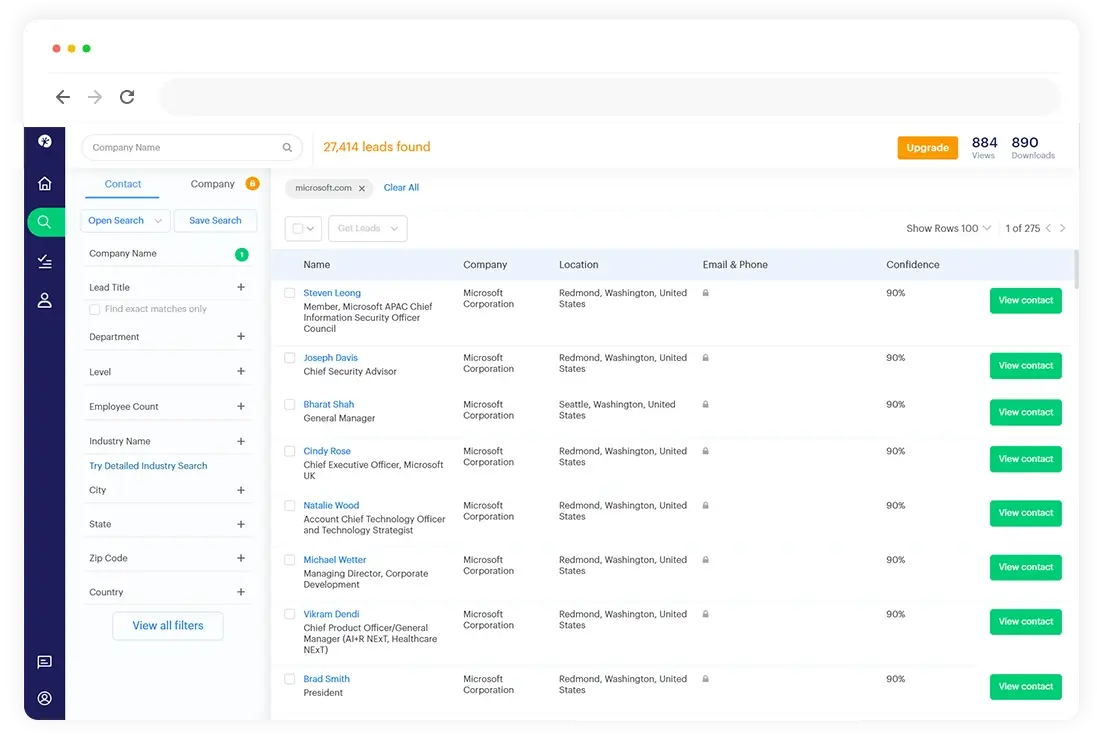 Access detailed market intelligence data and easily lookup leads with Adapt.
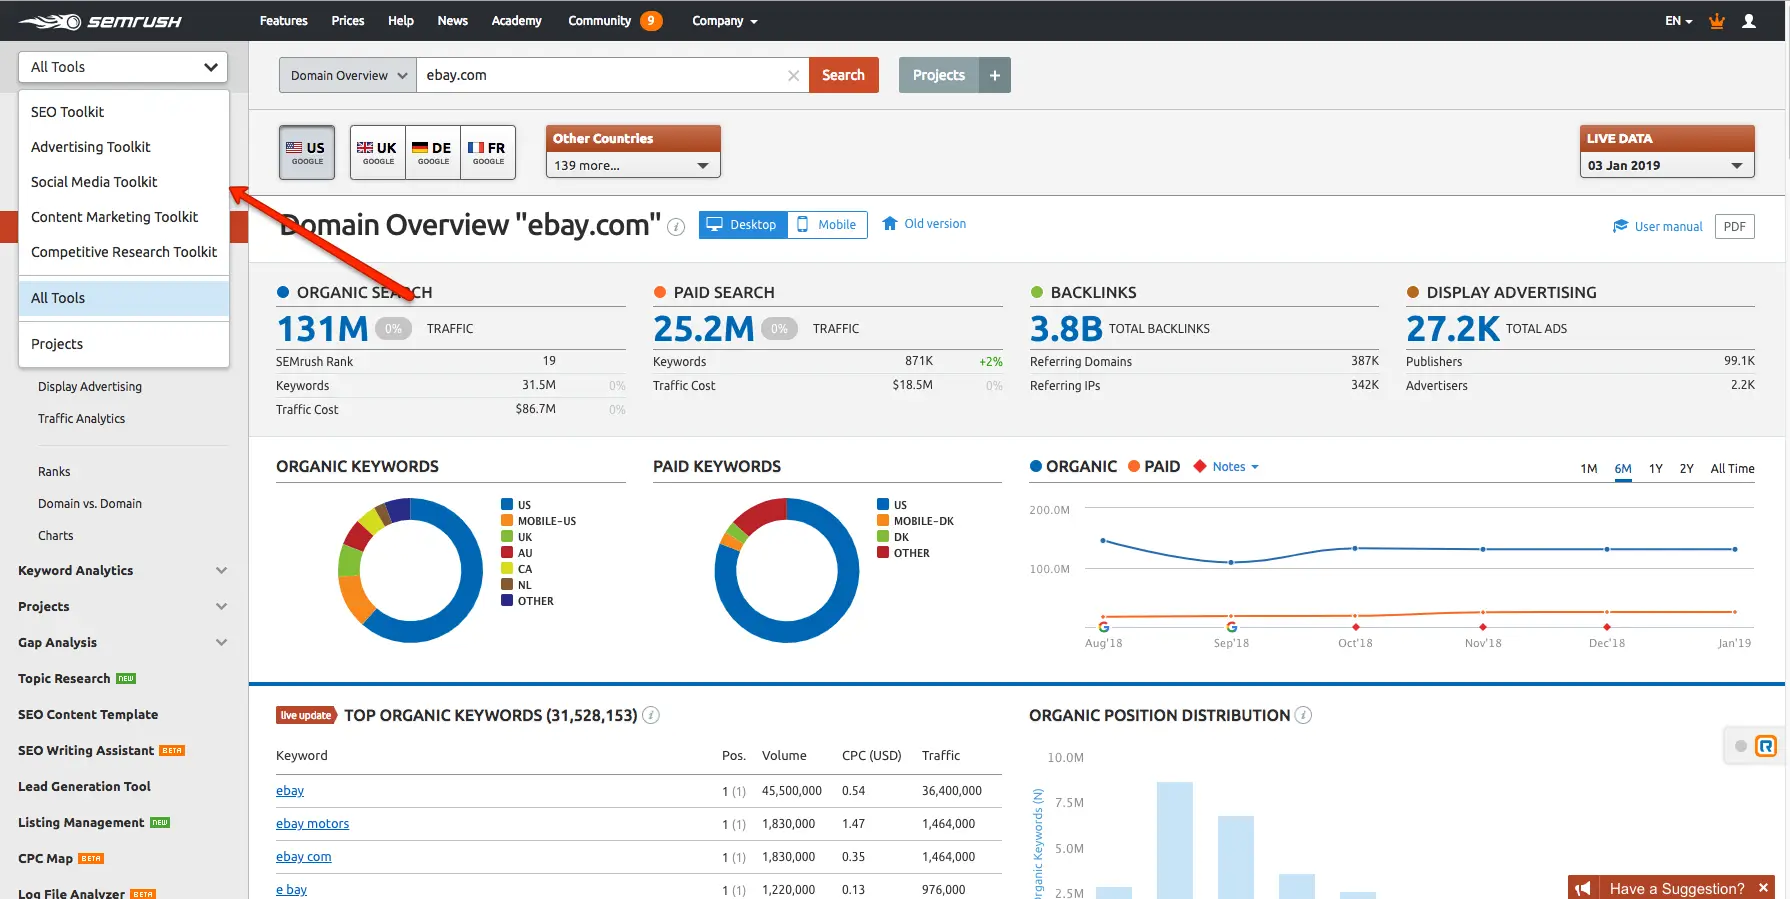 Gain an edge with Semrush's SEO-focused approach to market intelligence.
 Watch what matters and categorize them as needed with Demandbase.
 Easily compare your performance with everyone and track everyone's ad and spending habits with Similarweb.
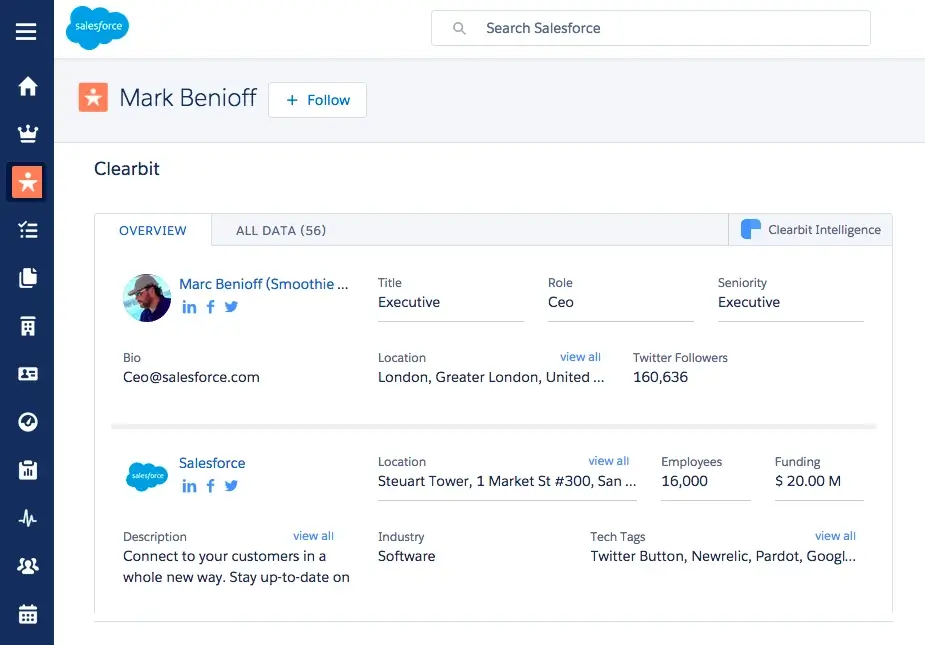 Never miss important data with Clearbit!
 Conveniently access all the data you need and seamlessly look up companies and people with UpLead.
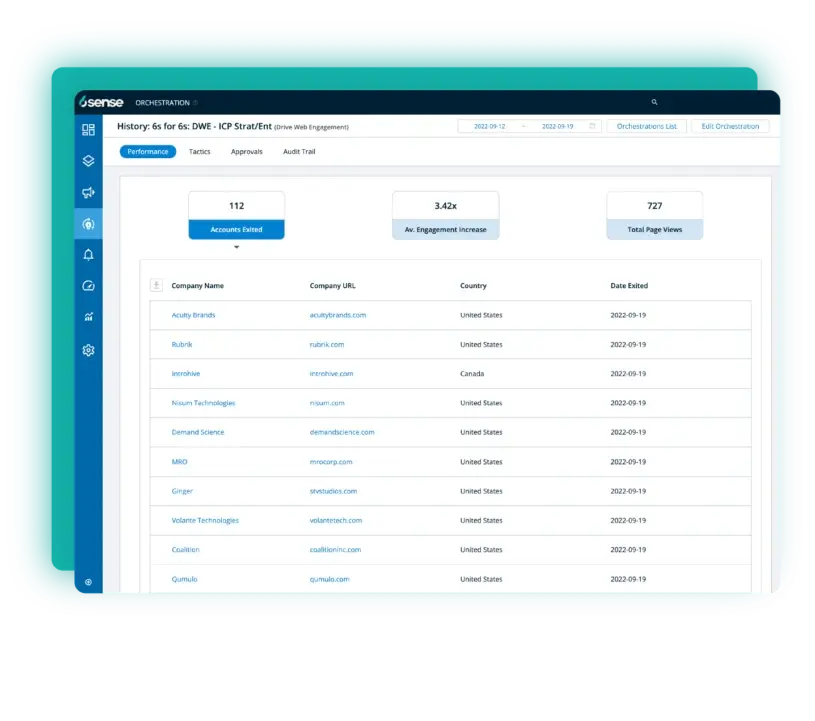 Track valuable metrics, segment your results, and integrate with multiple platforms using 6sense.
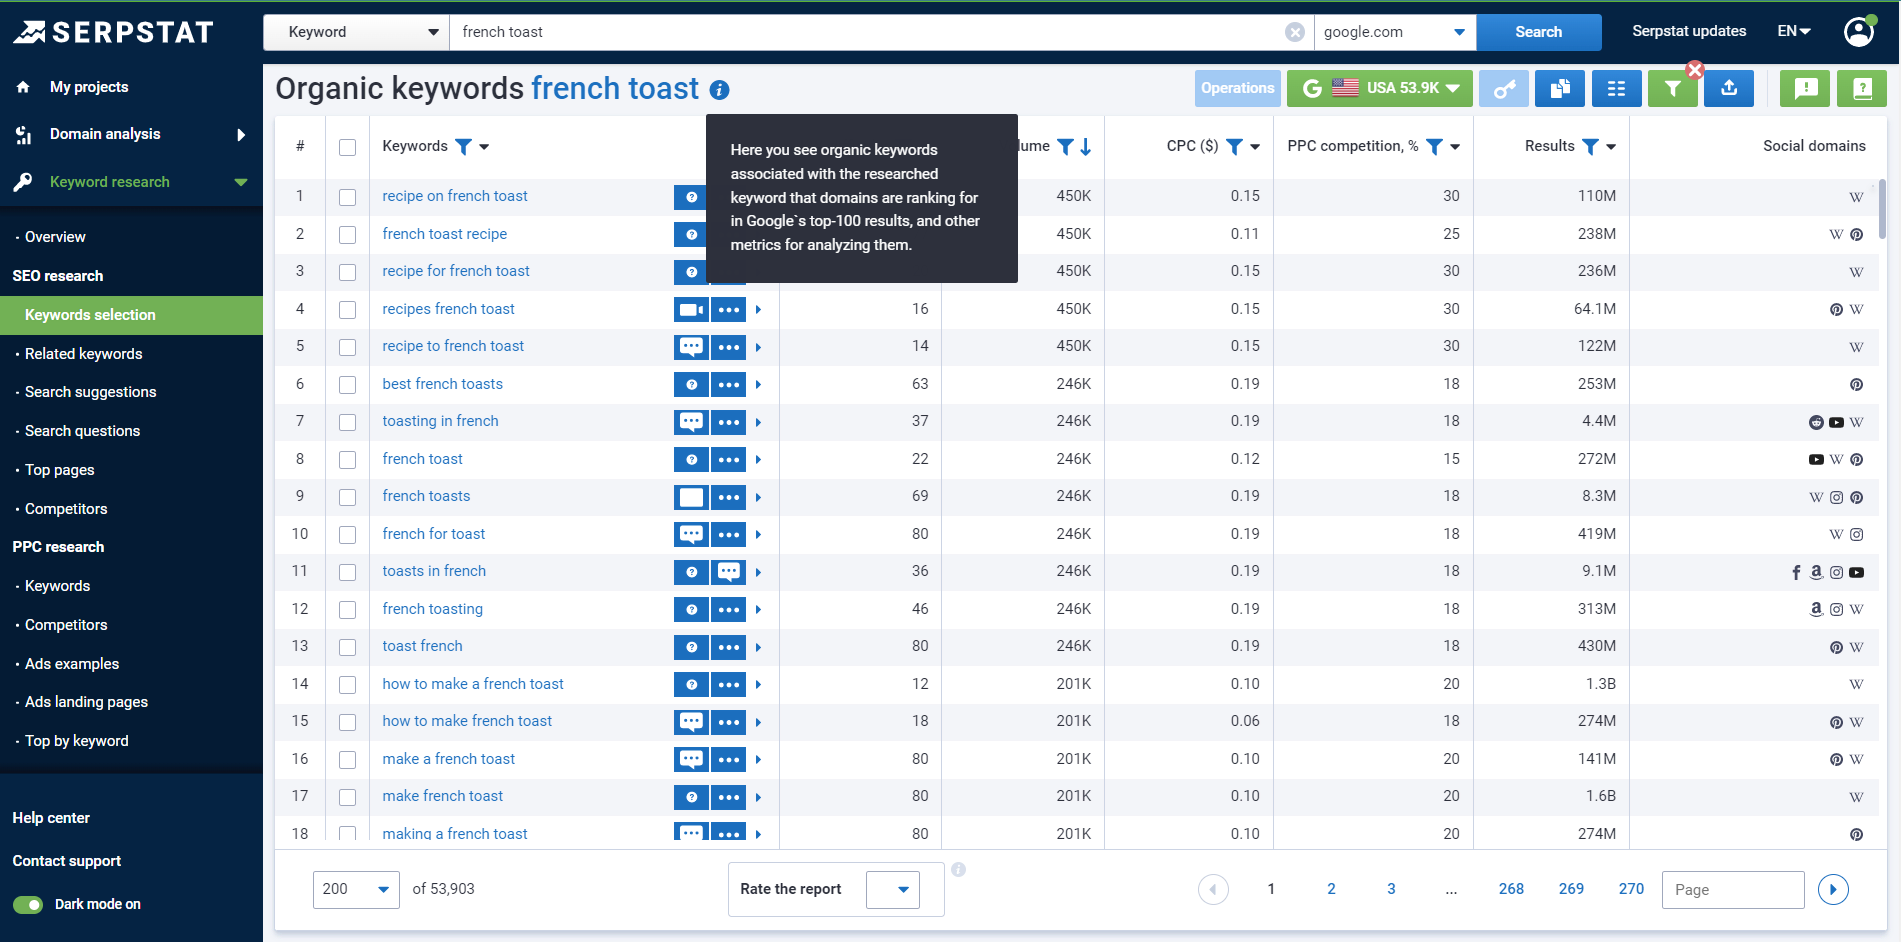 Stand out from the crowd and gain better data with Serpstat's SEO-focused approach to market intelligence.
 Each account matters – focus on them with Terminus.
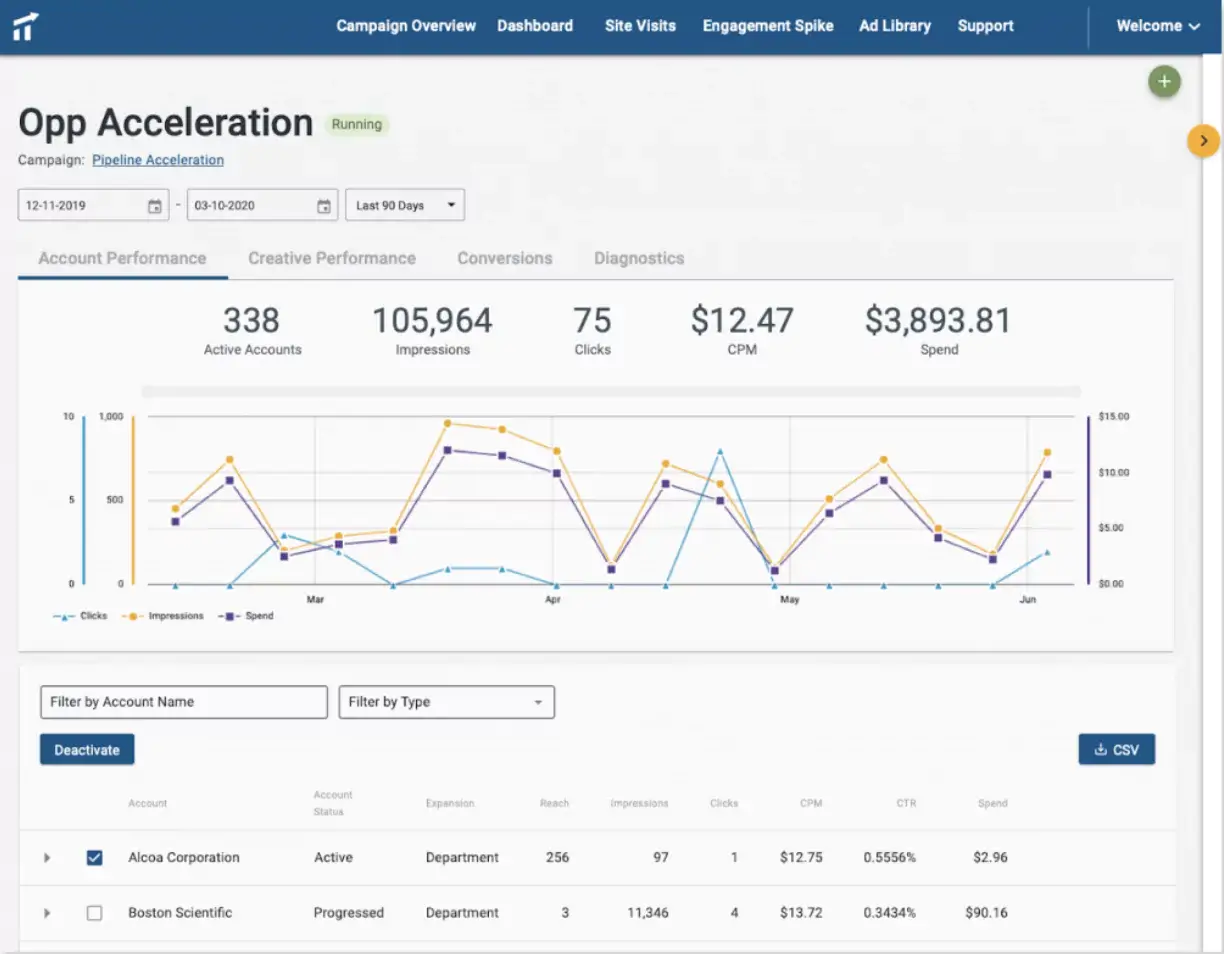 Keep yourself updated on your results with Terminus.
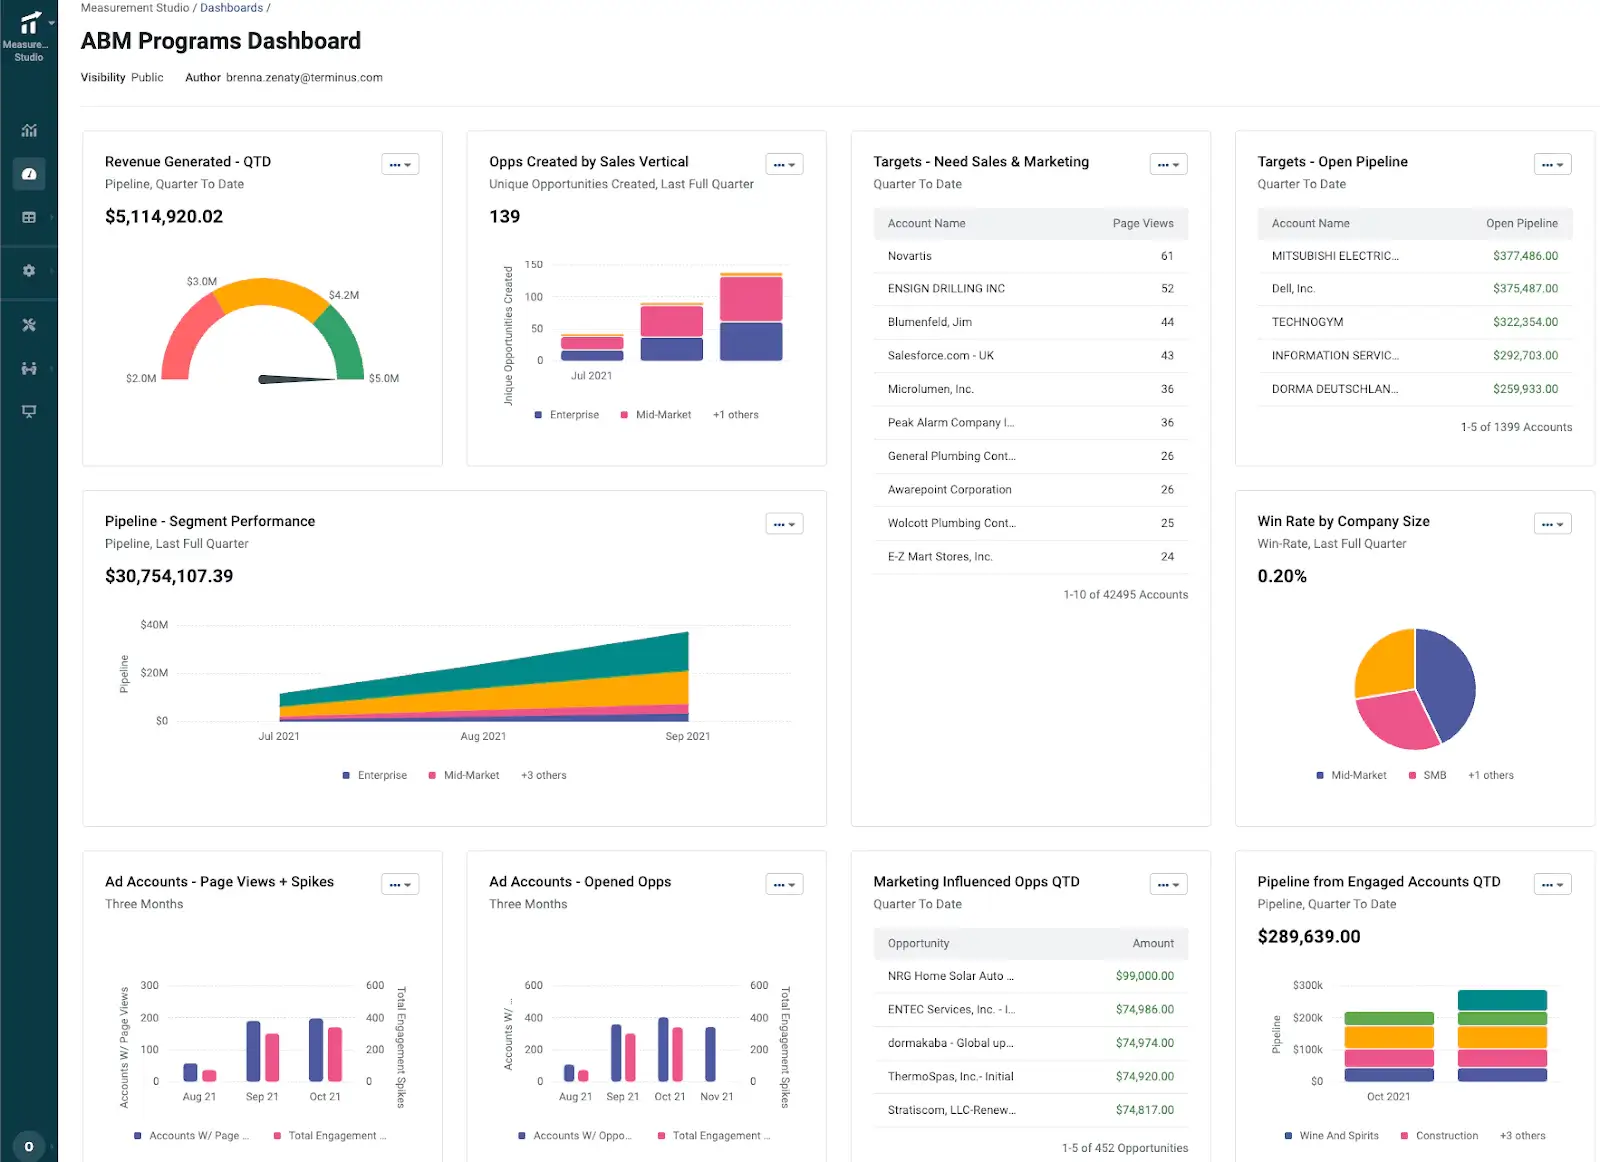 Monitor data points more effectively with Terminus’ insights and market segmentation.
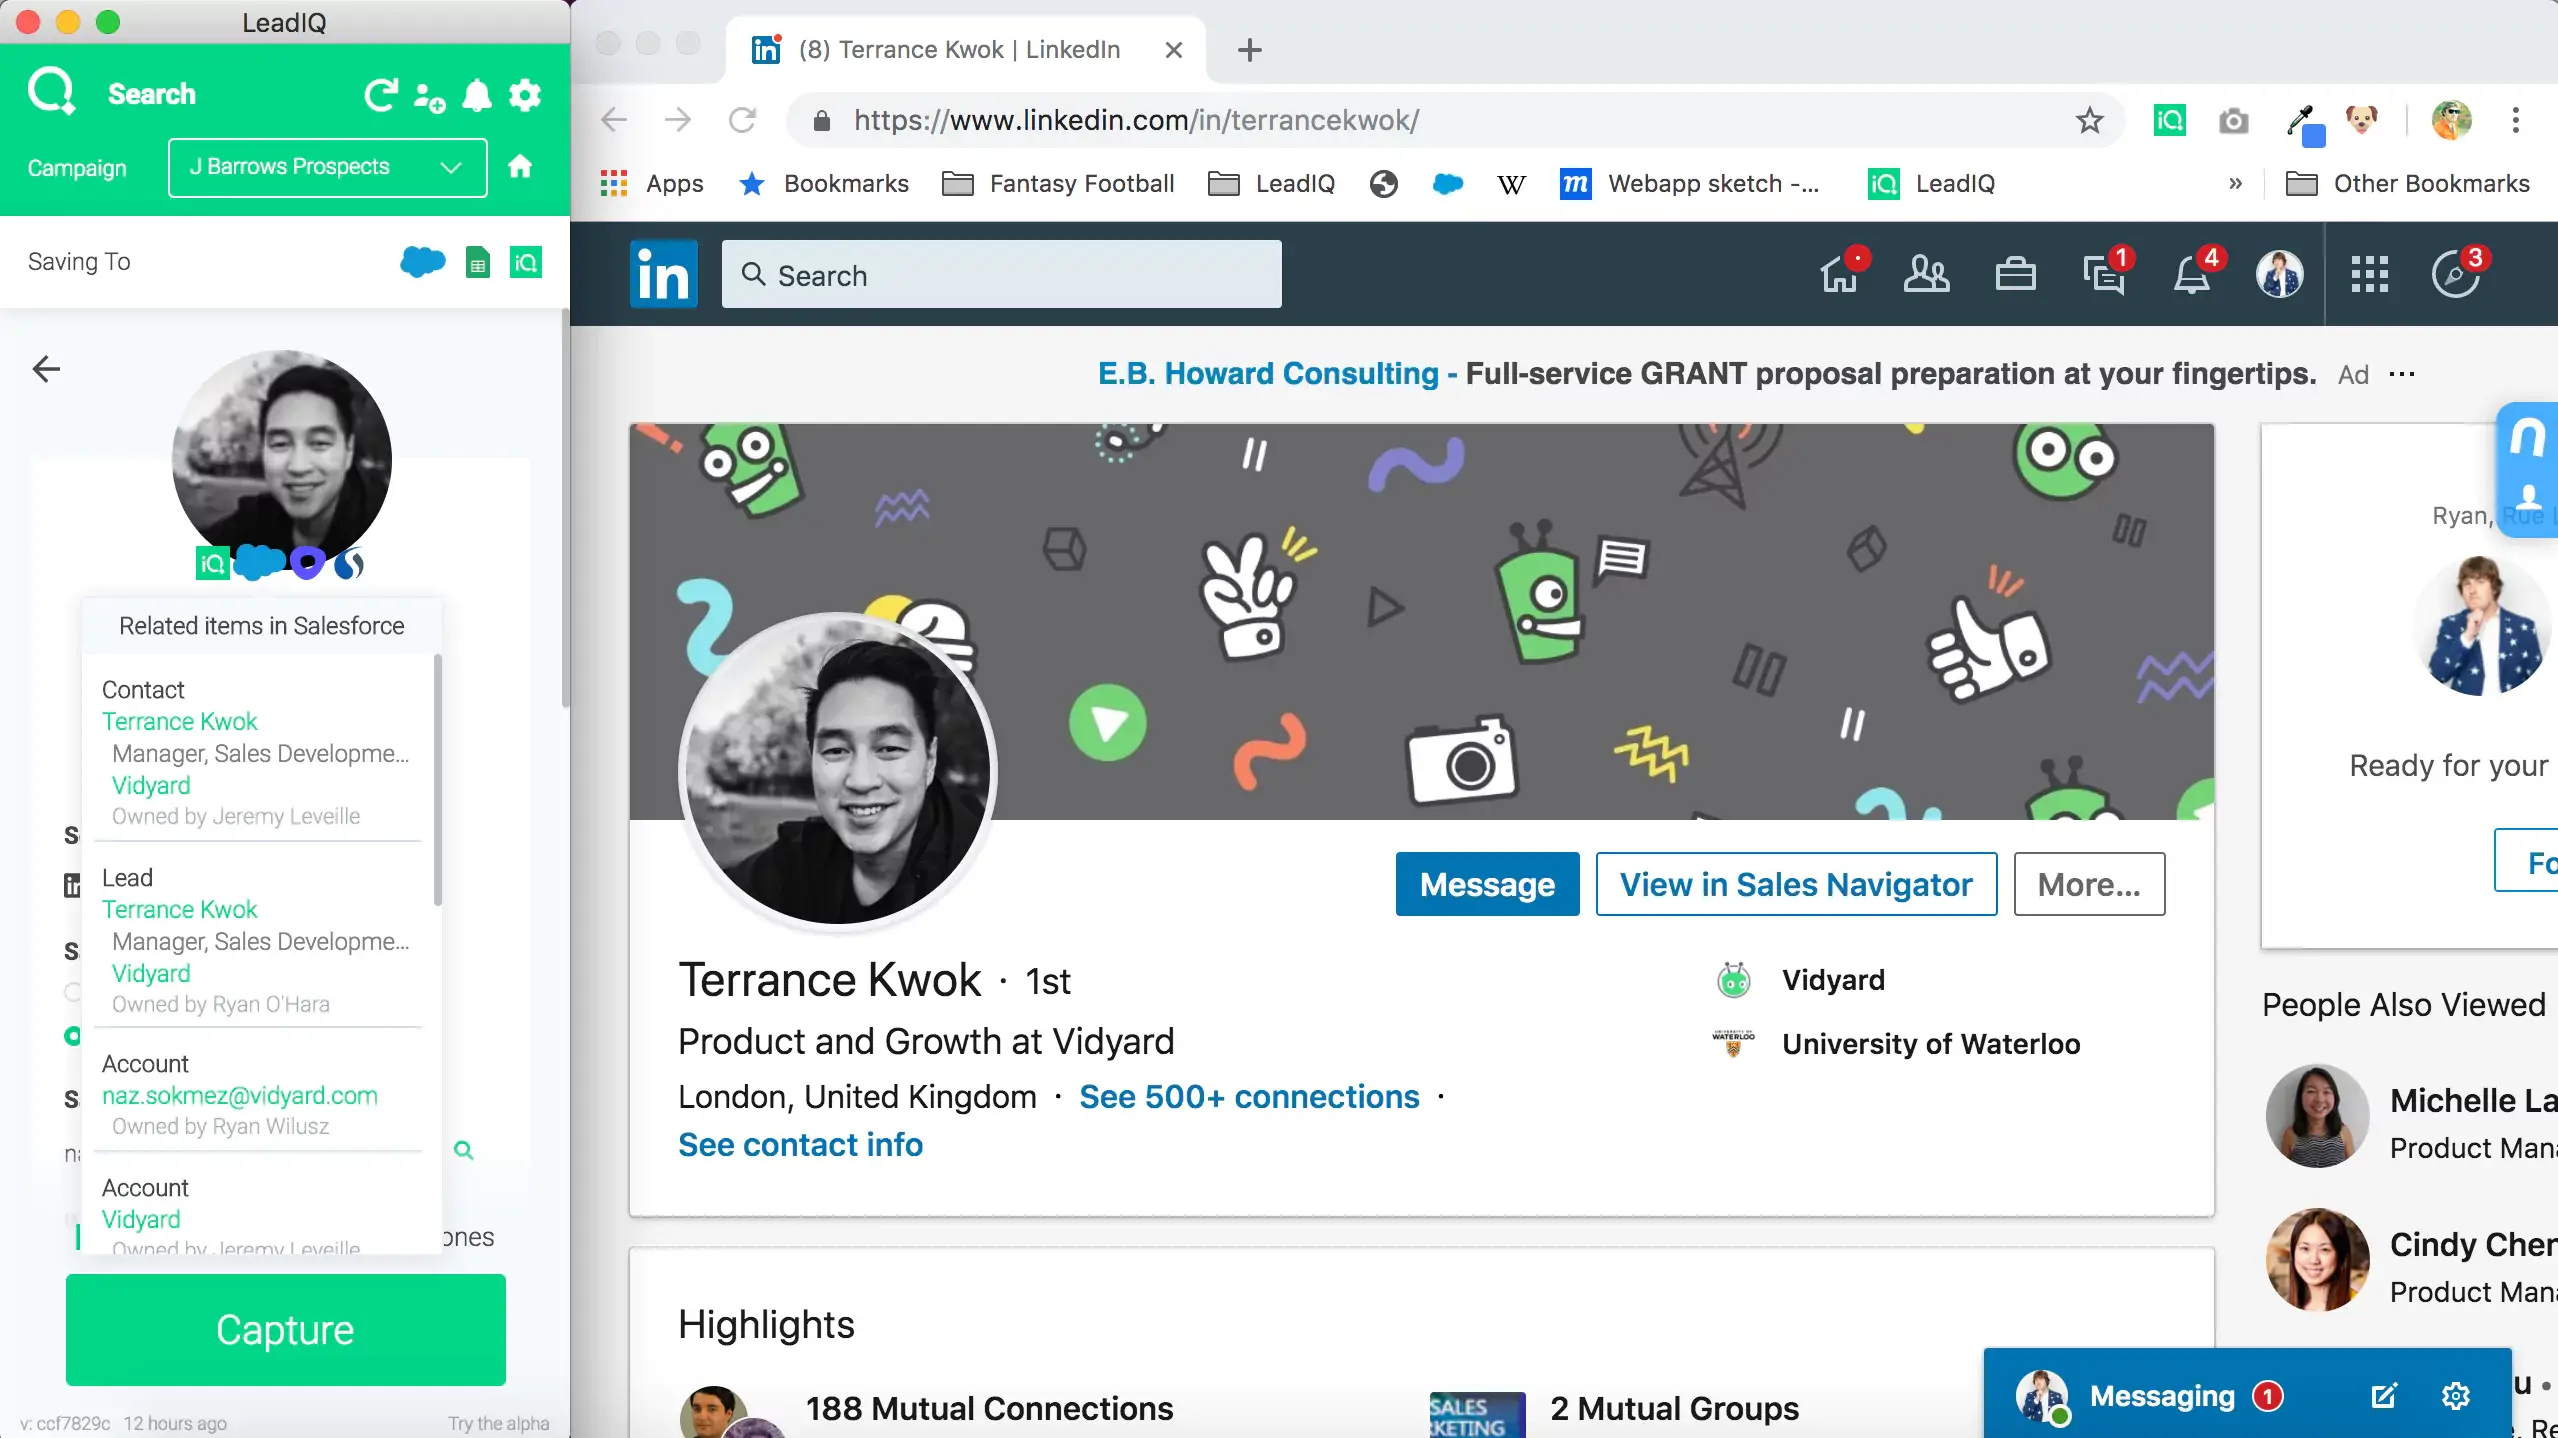 Effectively research your market with LeadIQ's email lookup, Chrome extension, and Salesforce integration.
 Understand everything you need in your industry with Lead411.
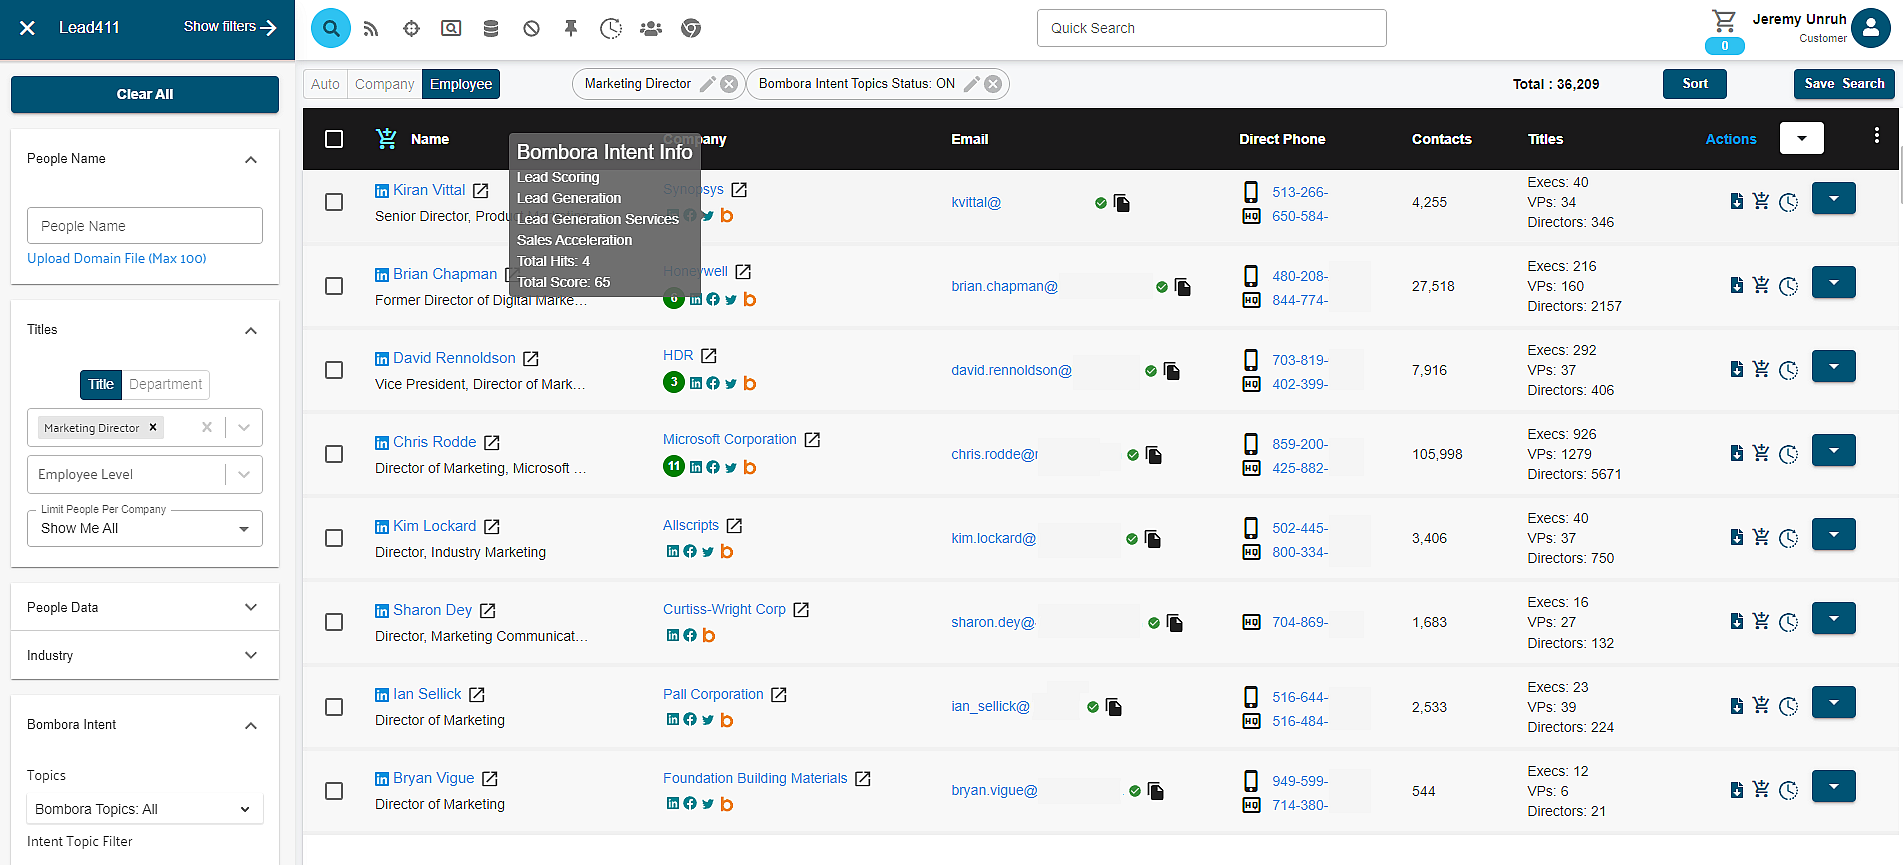 Easily view your leads’ scores and statistics with Lead411.
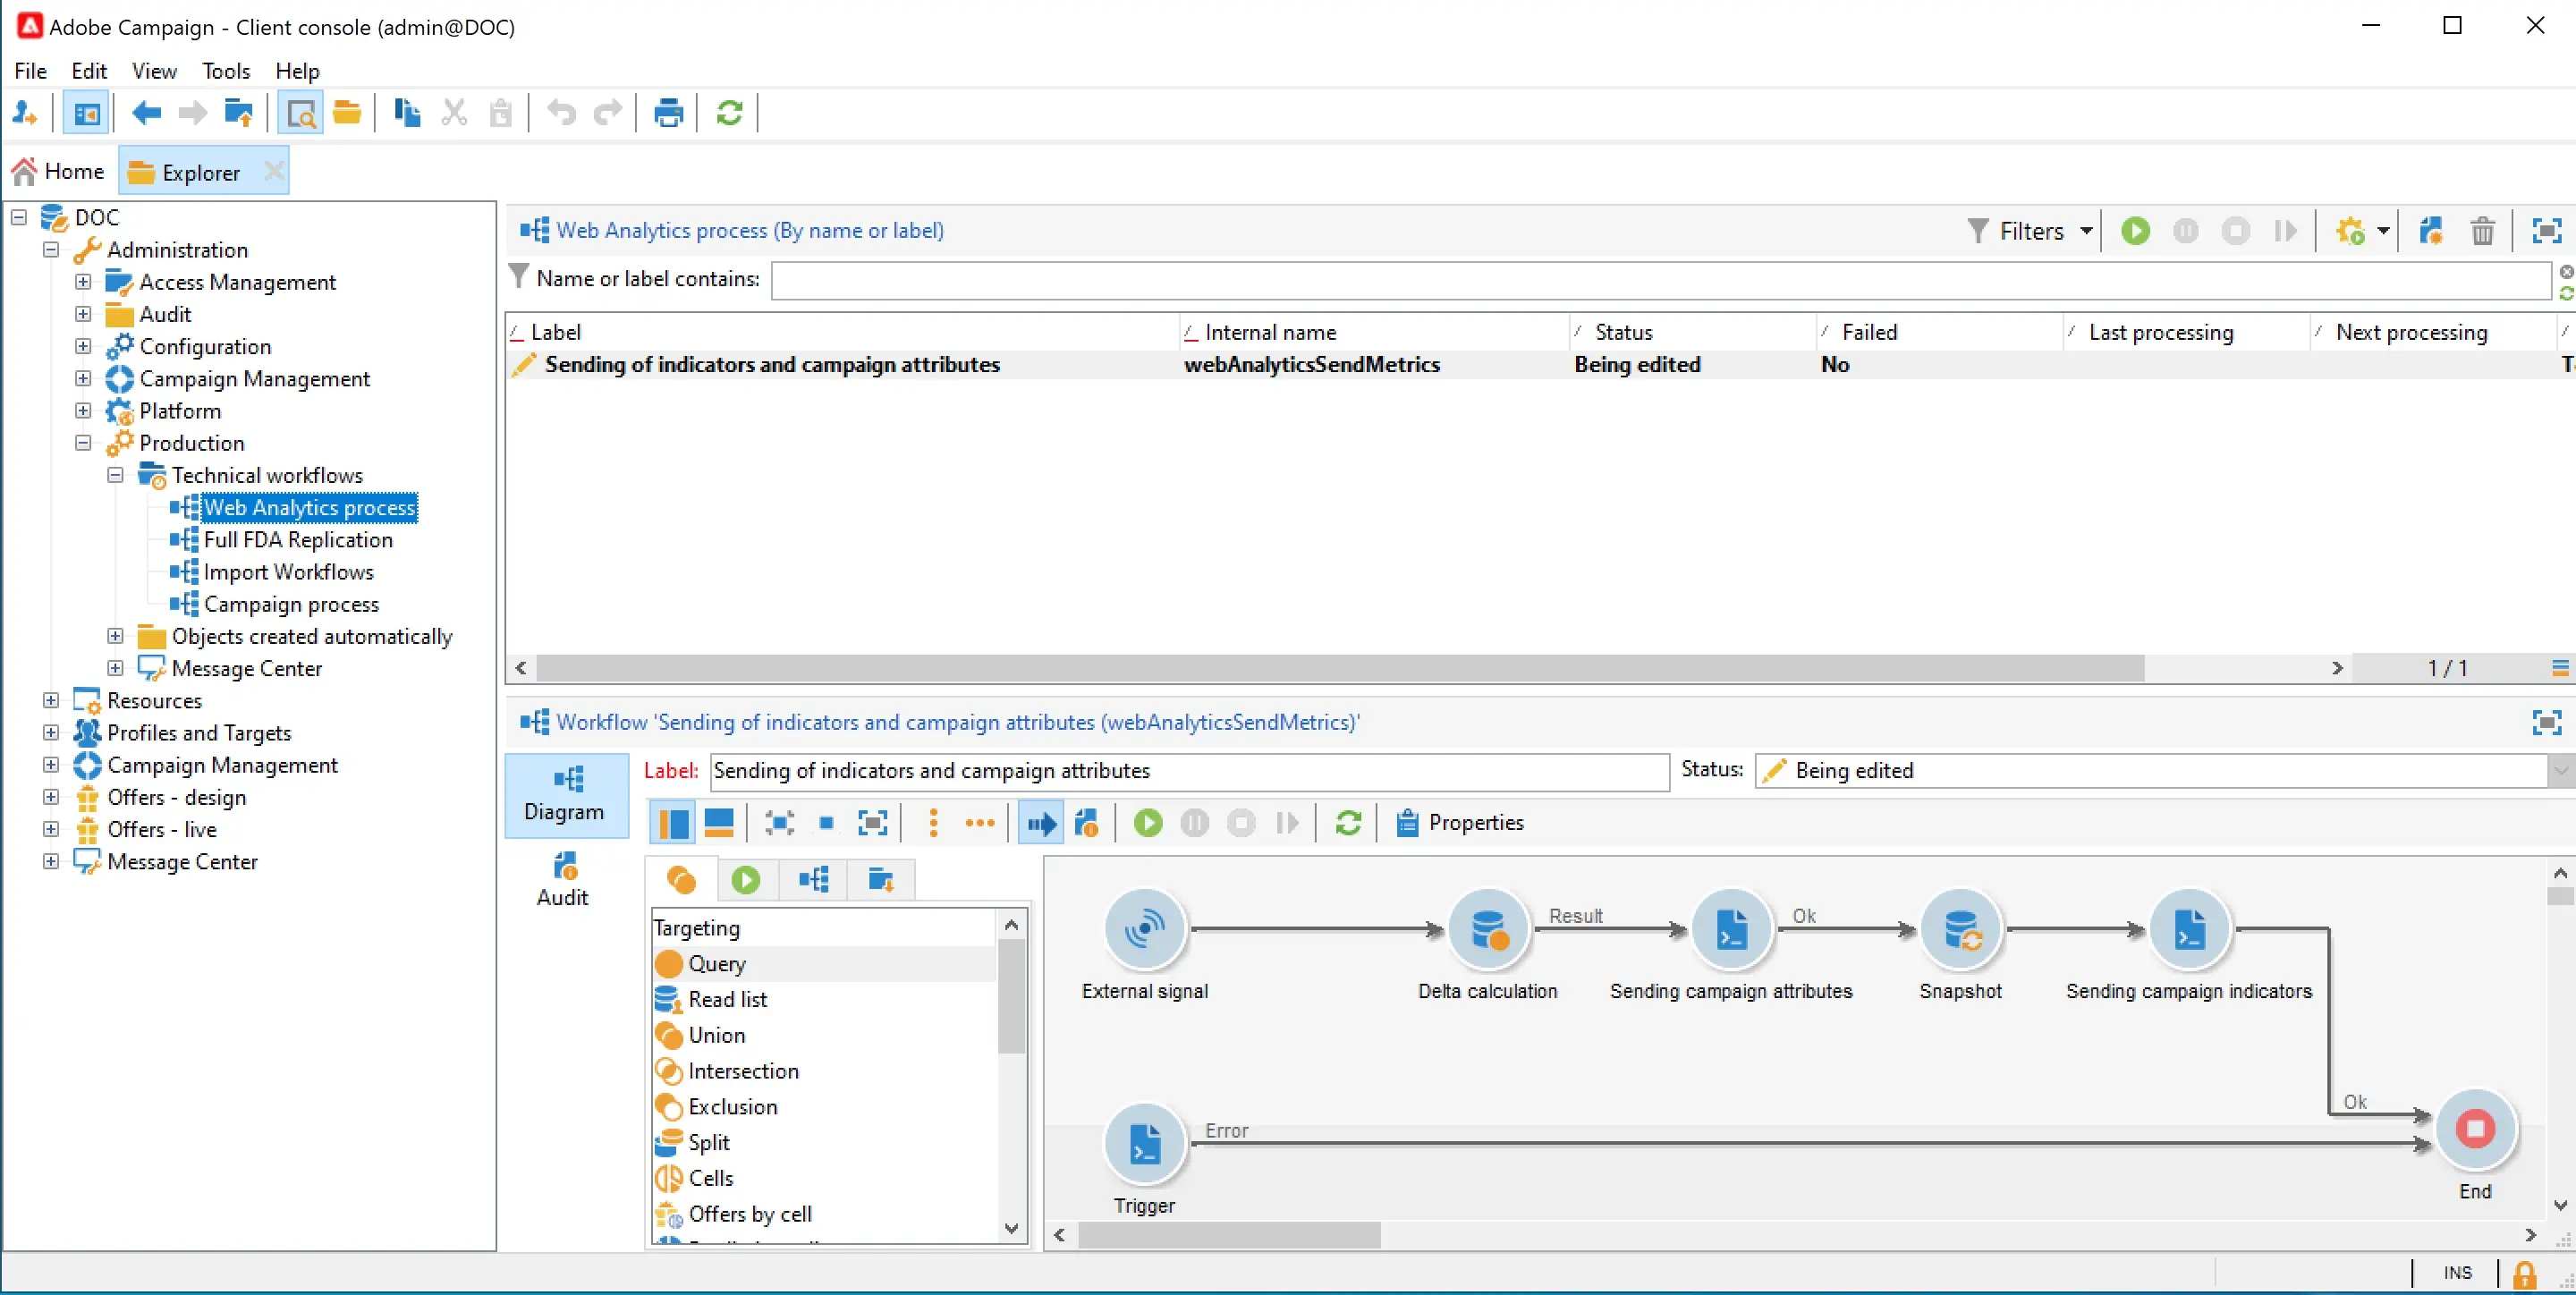 Seamlessly access templates, visualize journeys, segment lists, and efficiently manage data with Adobe Campaign.
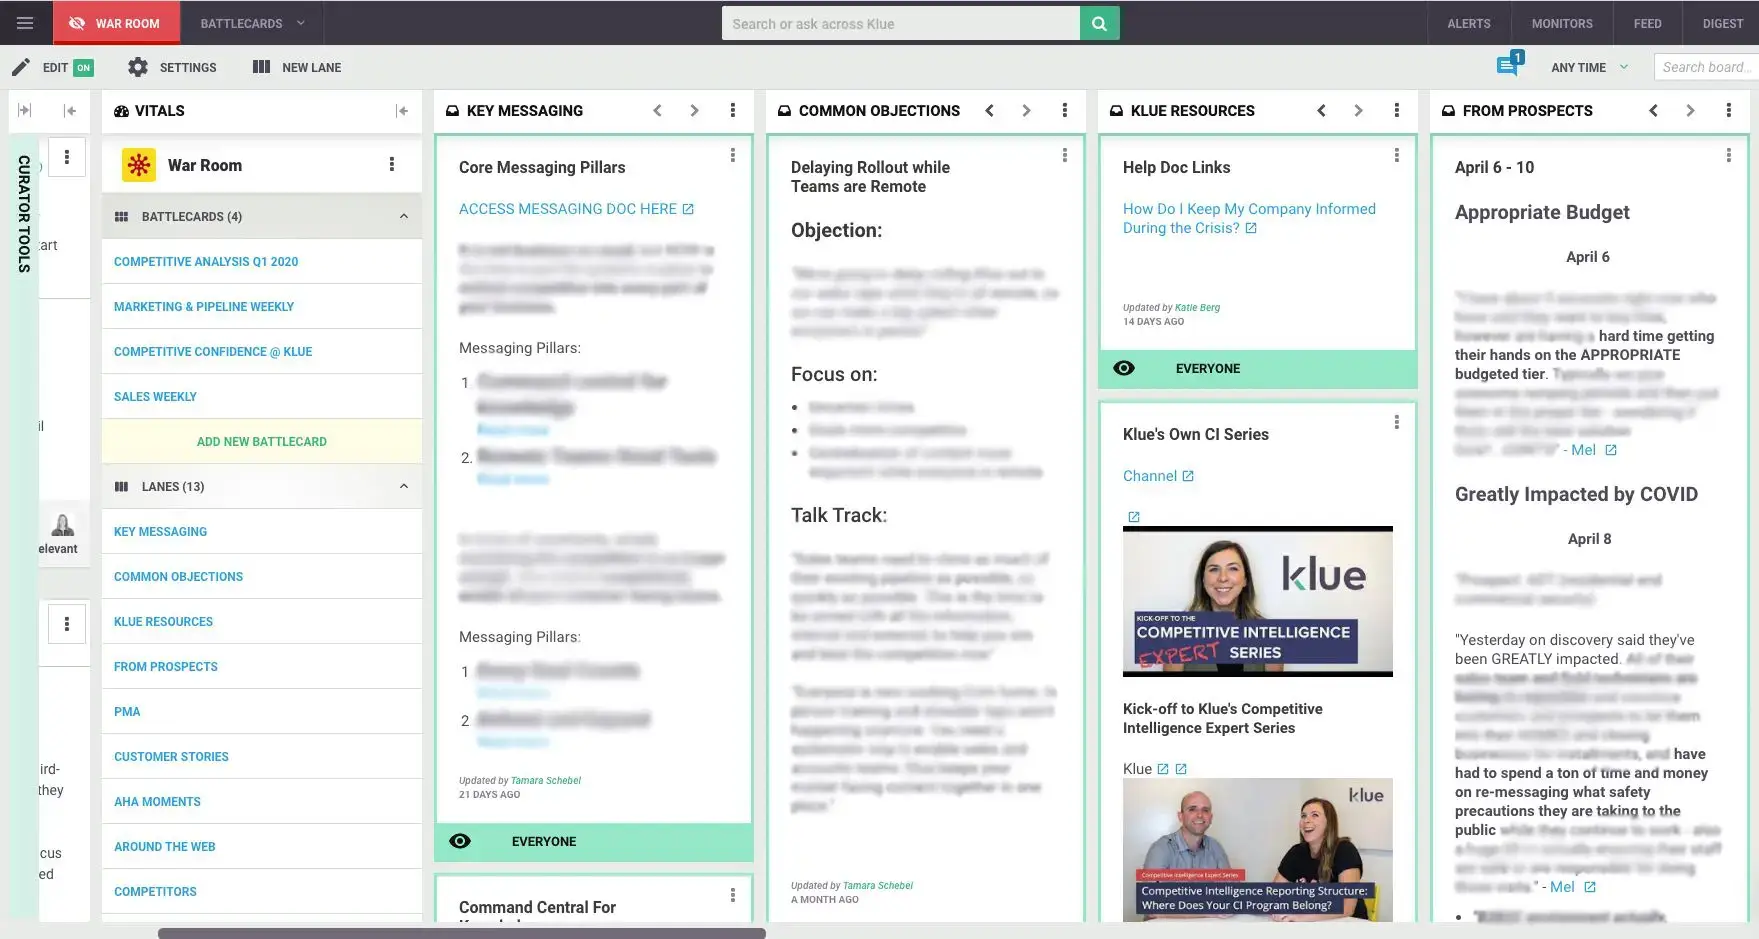 Enjoy collecting market intelligence with Klue's stunning visuals, simple interface, and detailed reports.
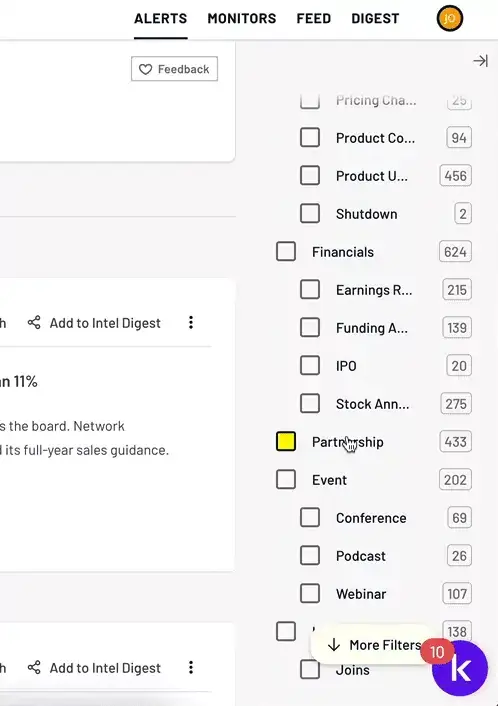 Stay updated on your competitors with Klue's handy news dashboard.
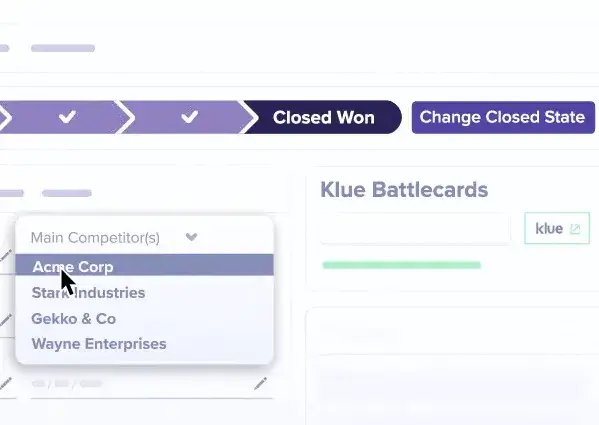 Need to track competitor updates without obsessively checking their channels? Use Klue's tracking feature!
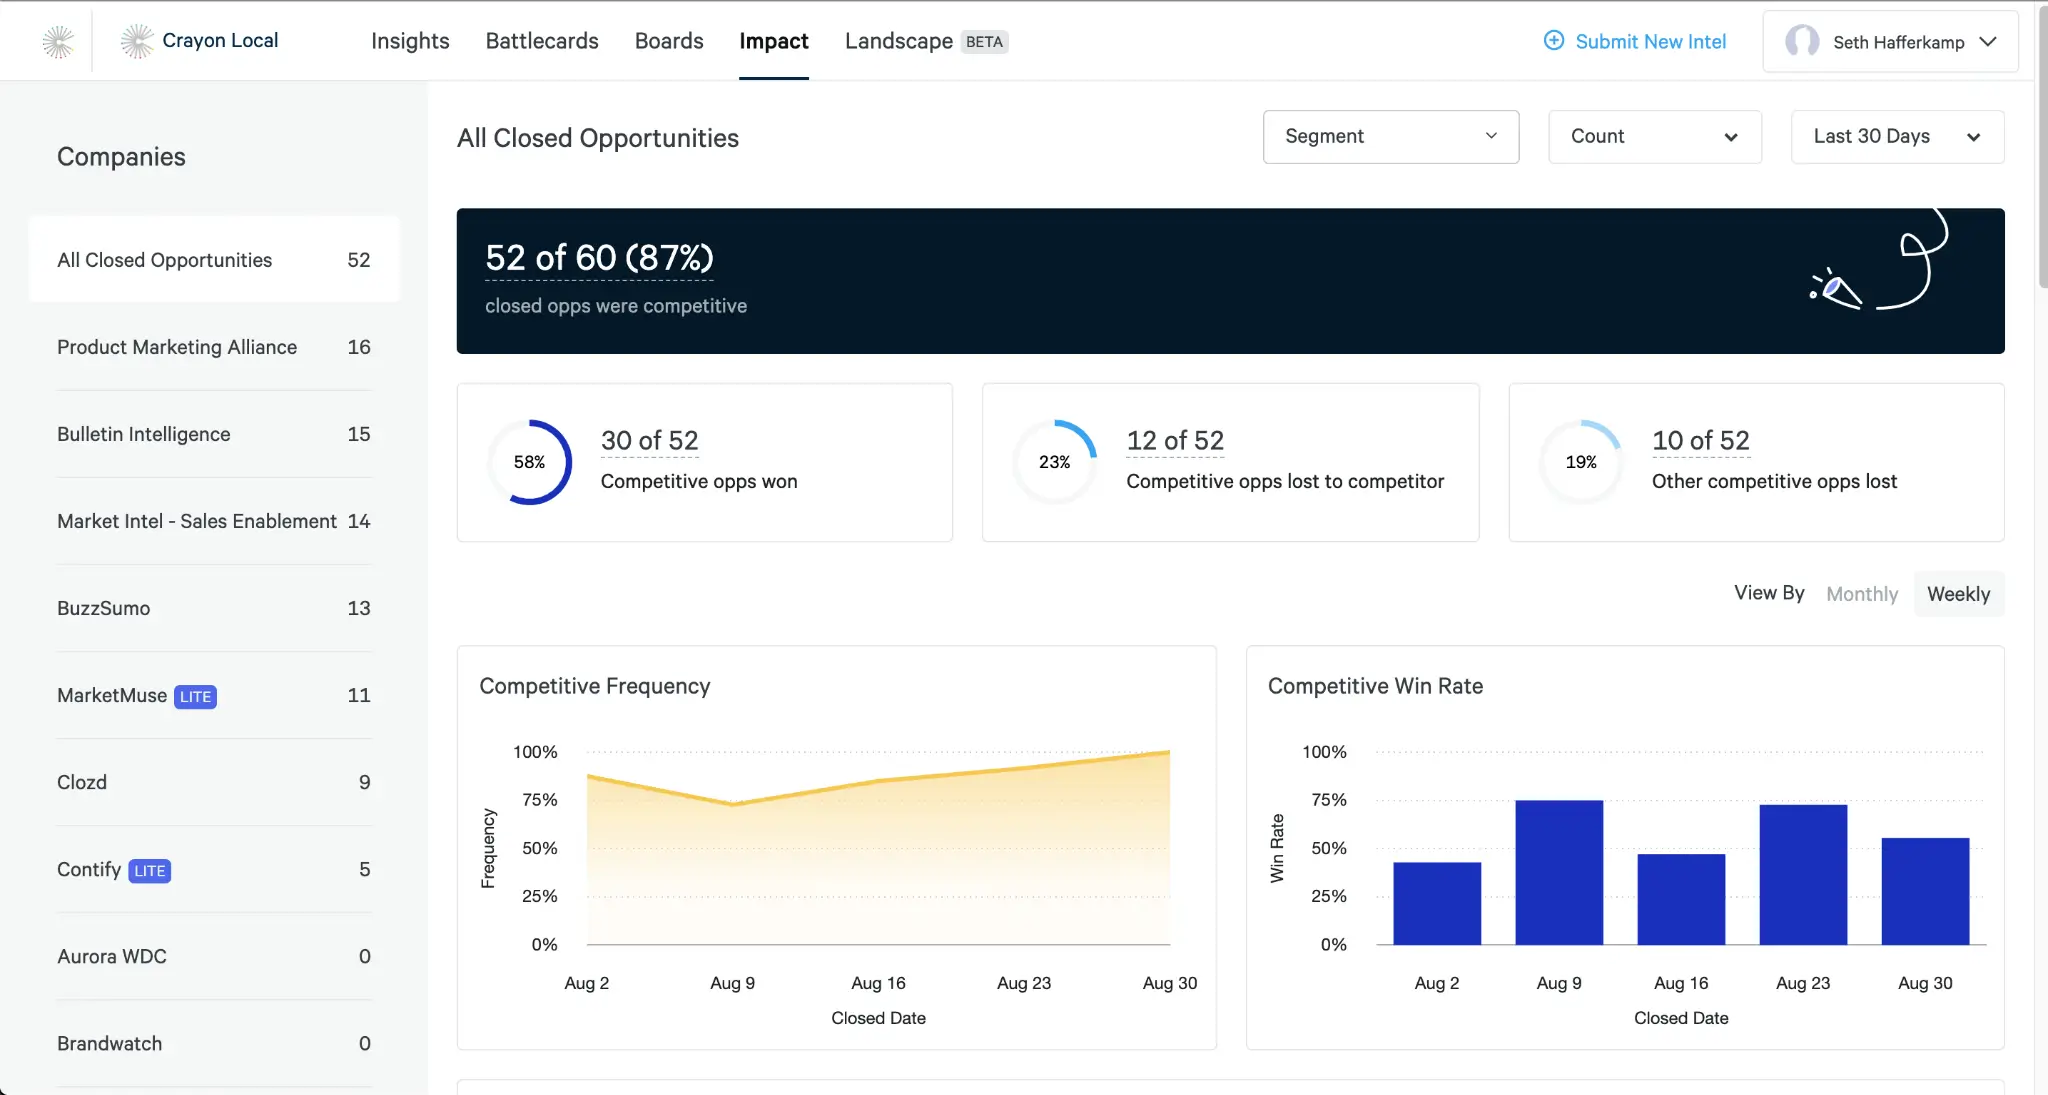 Scrape the web with ease and see how your results stack up against competitors with Crayon.
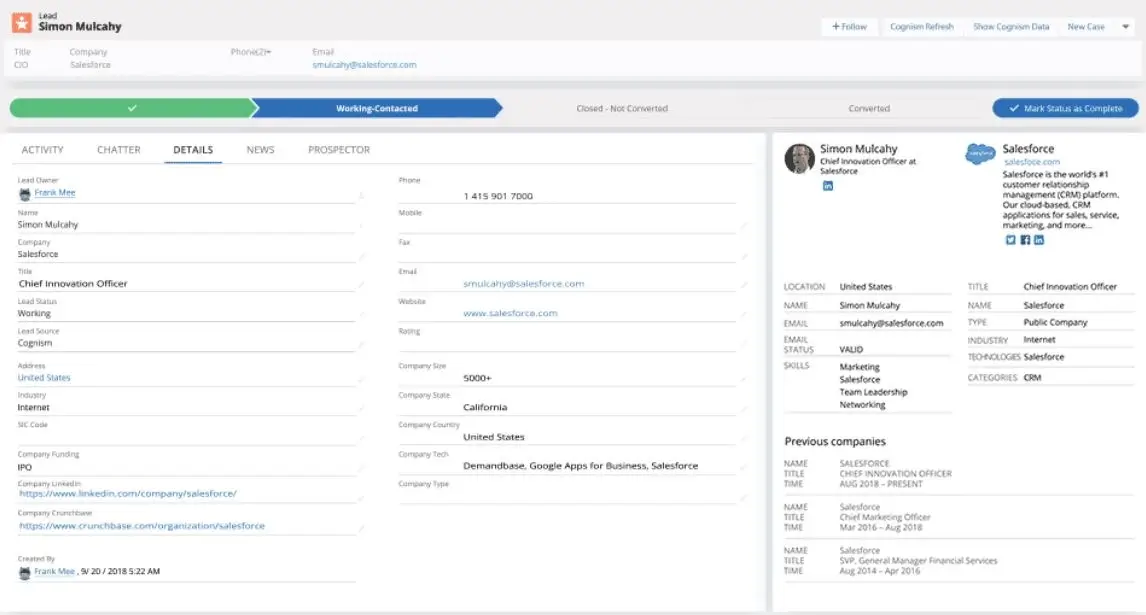 Watch your leads and keep and update their information in one place with Cognism.
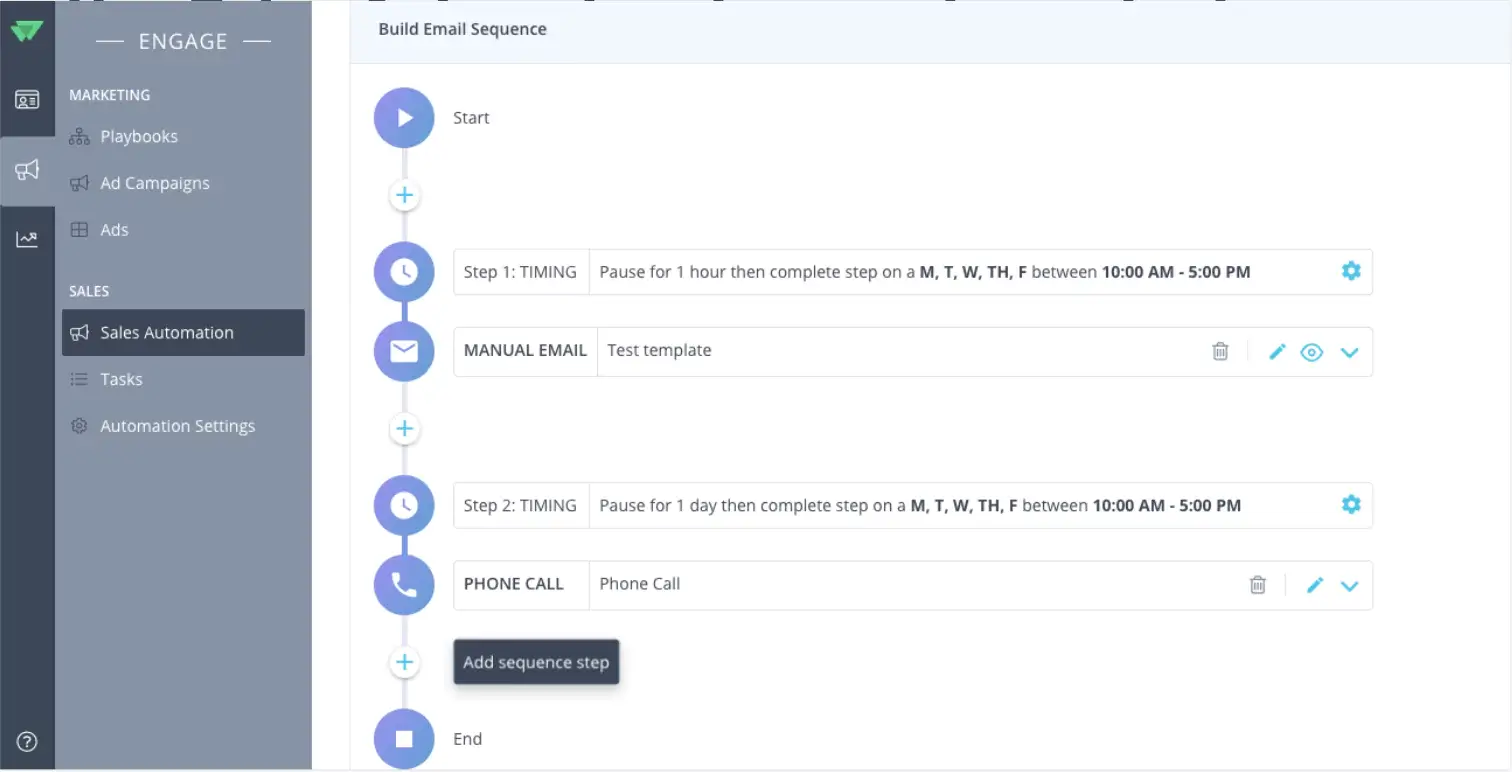 Keep your leads engaged wwith automated email sequences, track their journeys, and more with RollWorks.
 Research and discover new markets, closely monitor them in your dashboard, and more with ZoomInfo OperationsOS.
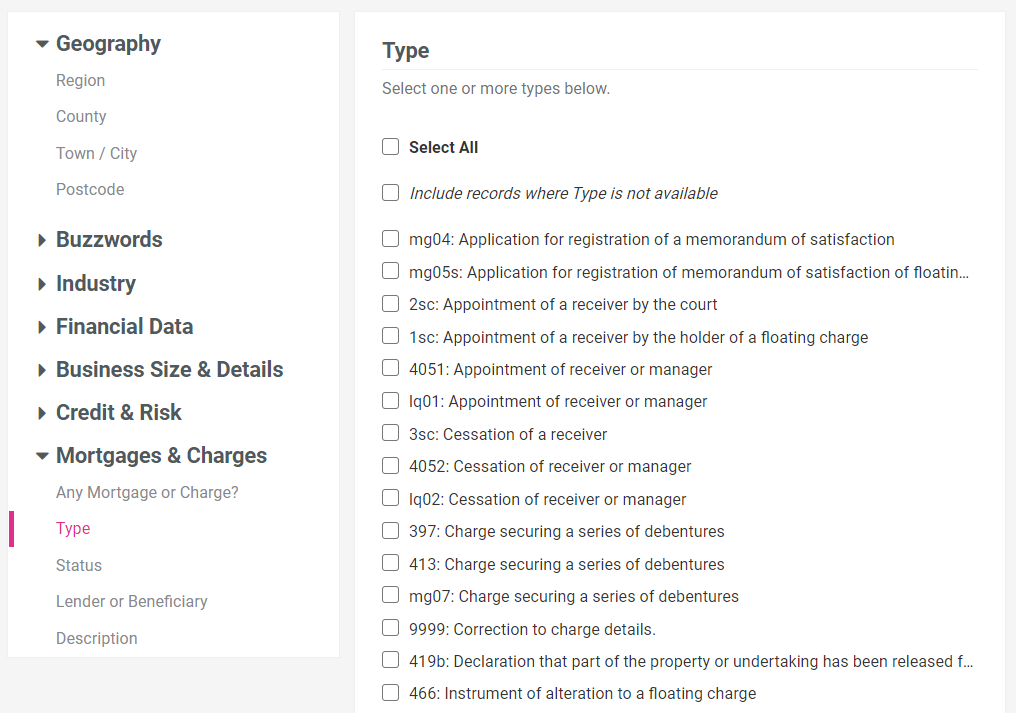 Gather market intelligence and seamlessly sort through your data with FullCircl.
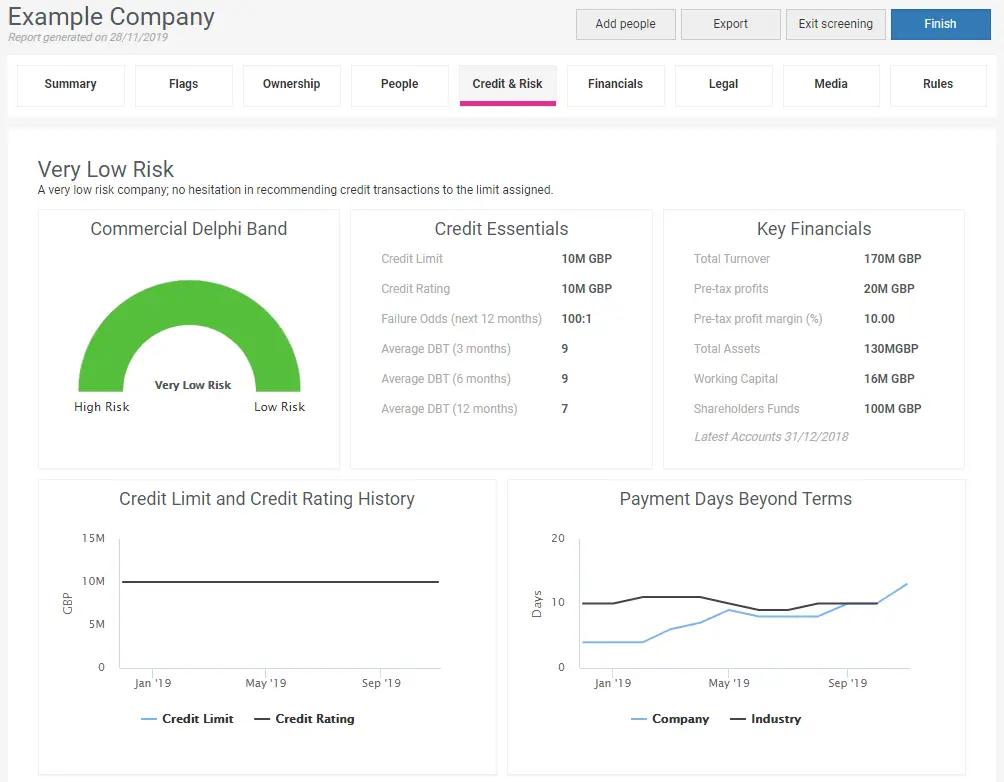 Discover a company's financial statistics and more with FullCircl.
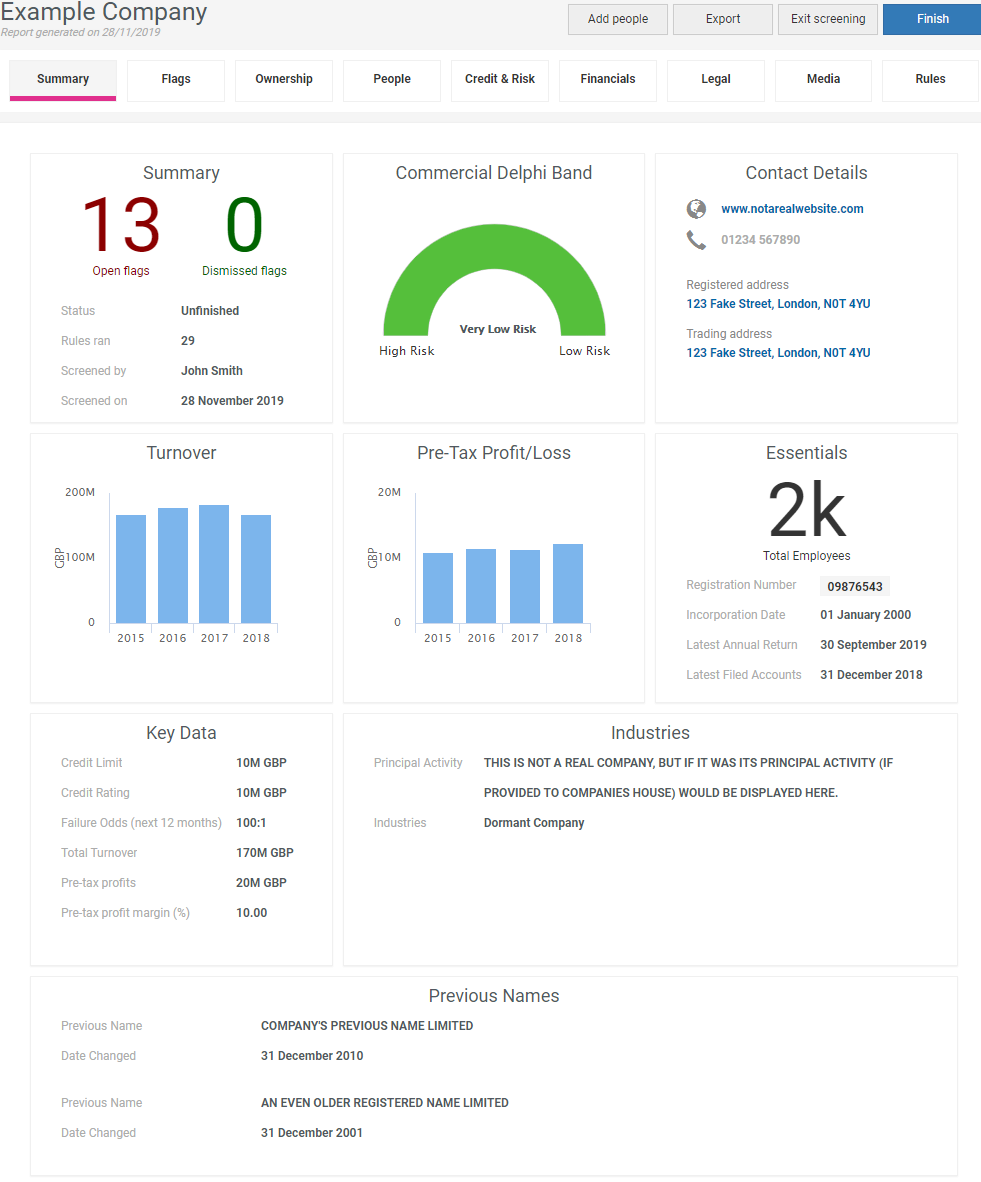 Search for companies based on particular categories and access everything you need to know about them with FullCircl.
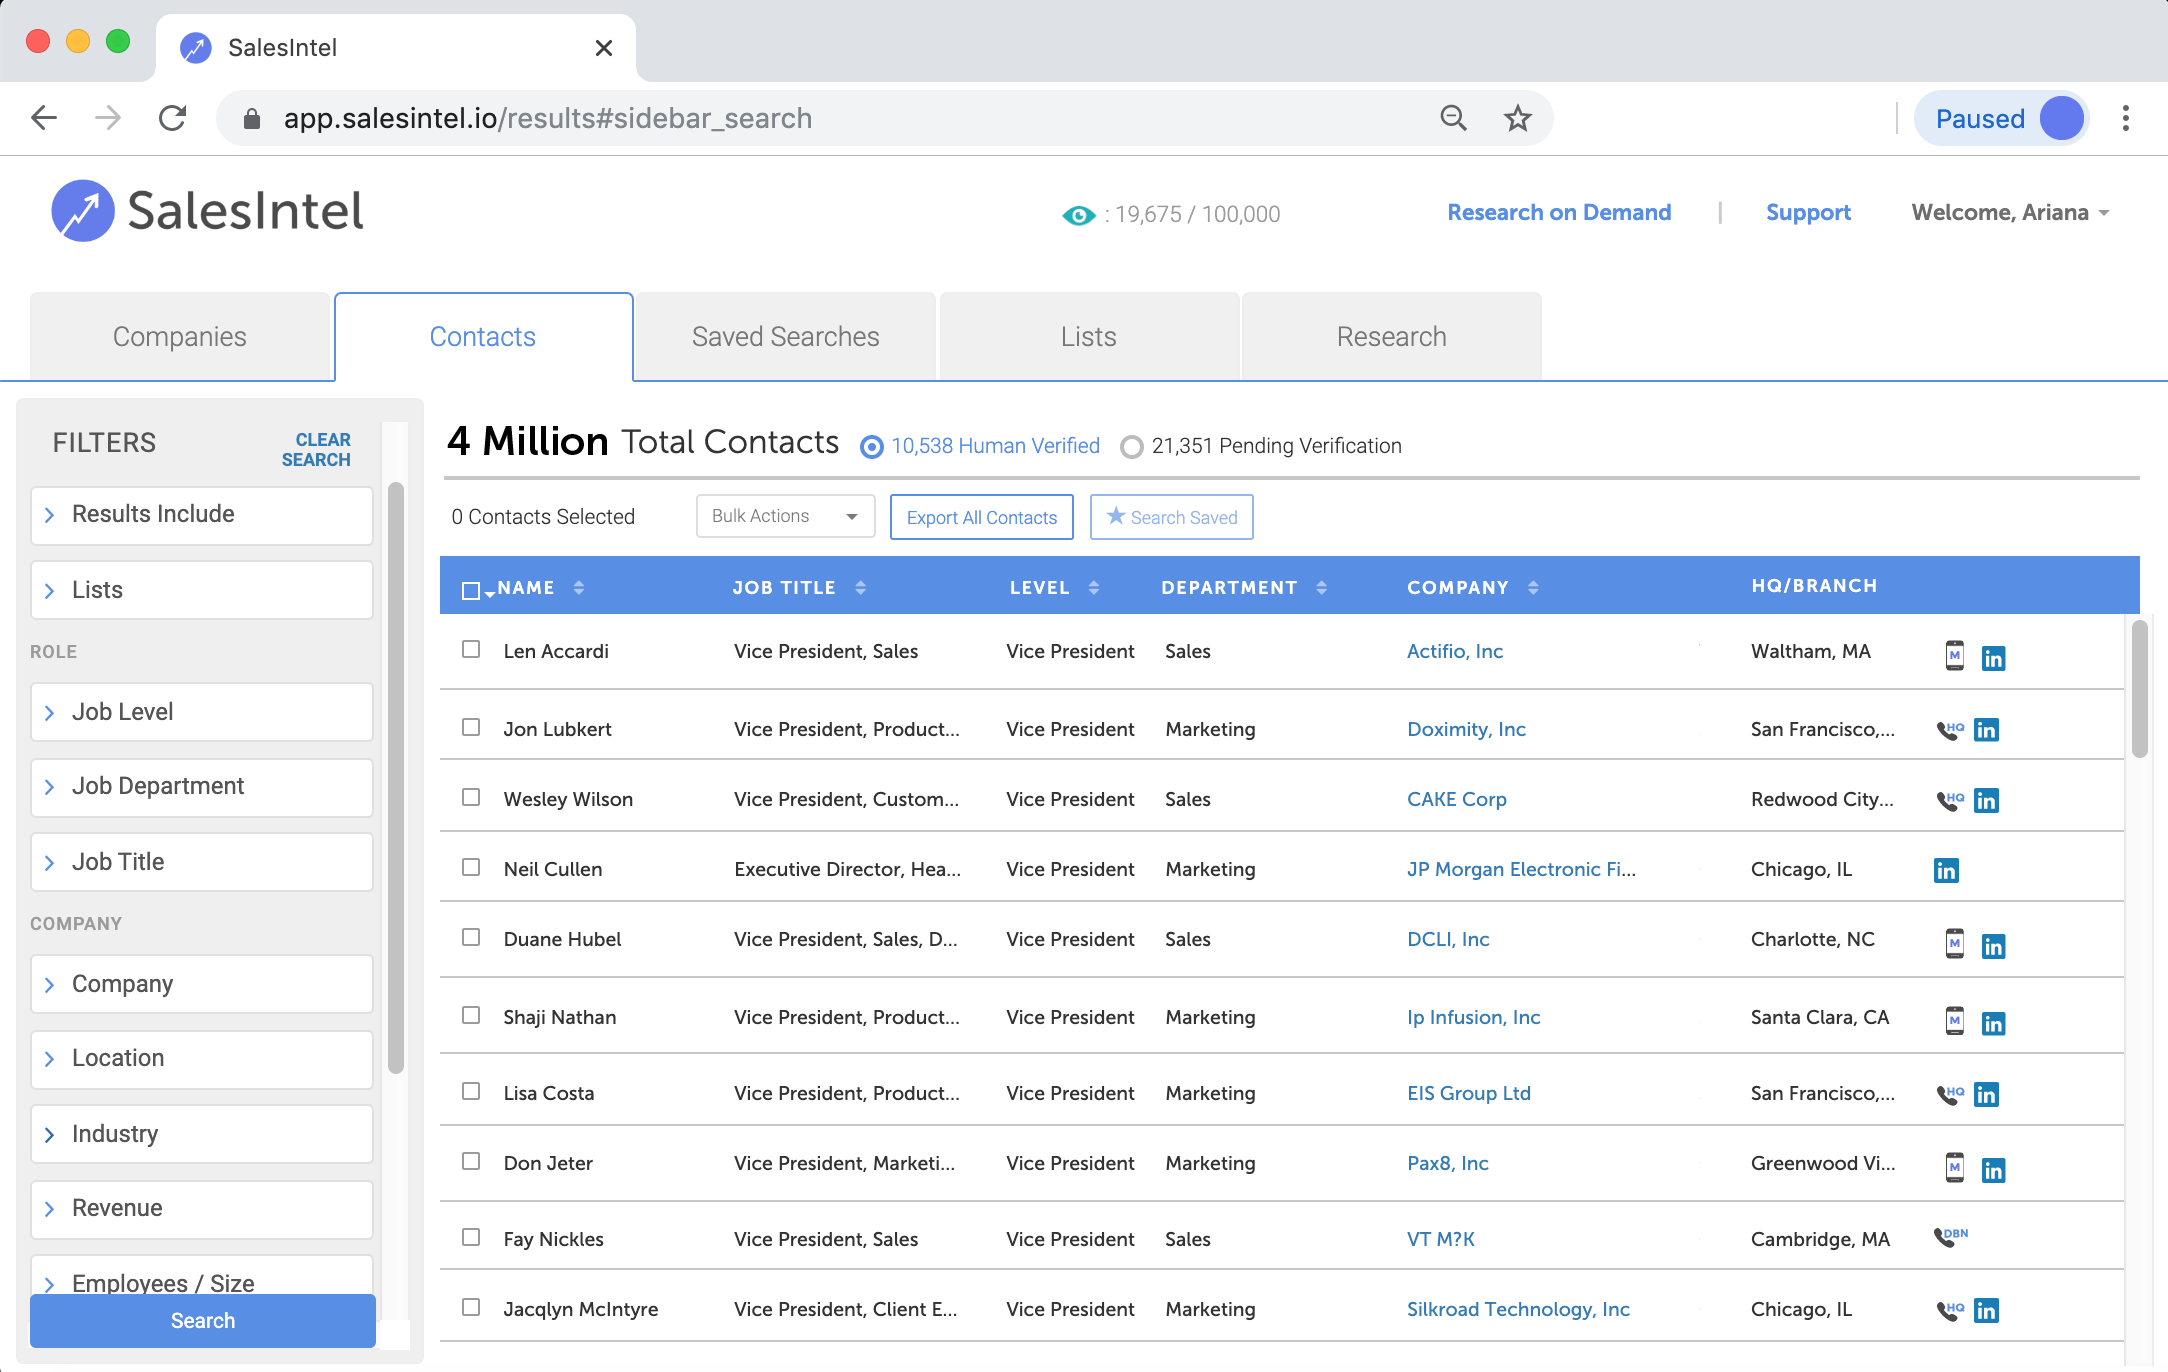 Enjoy a mix of human-verified contacts and predictive analytics with SalesIntel.
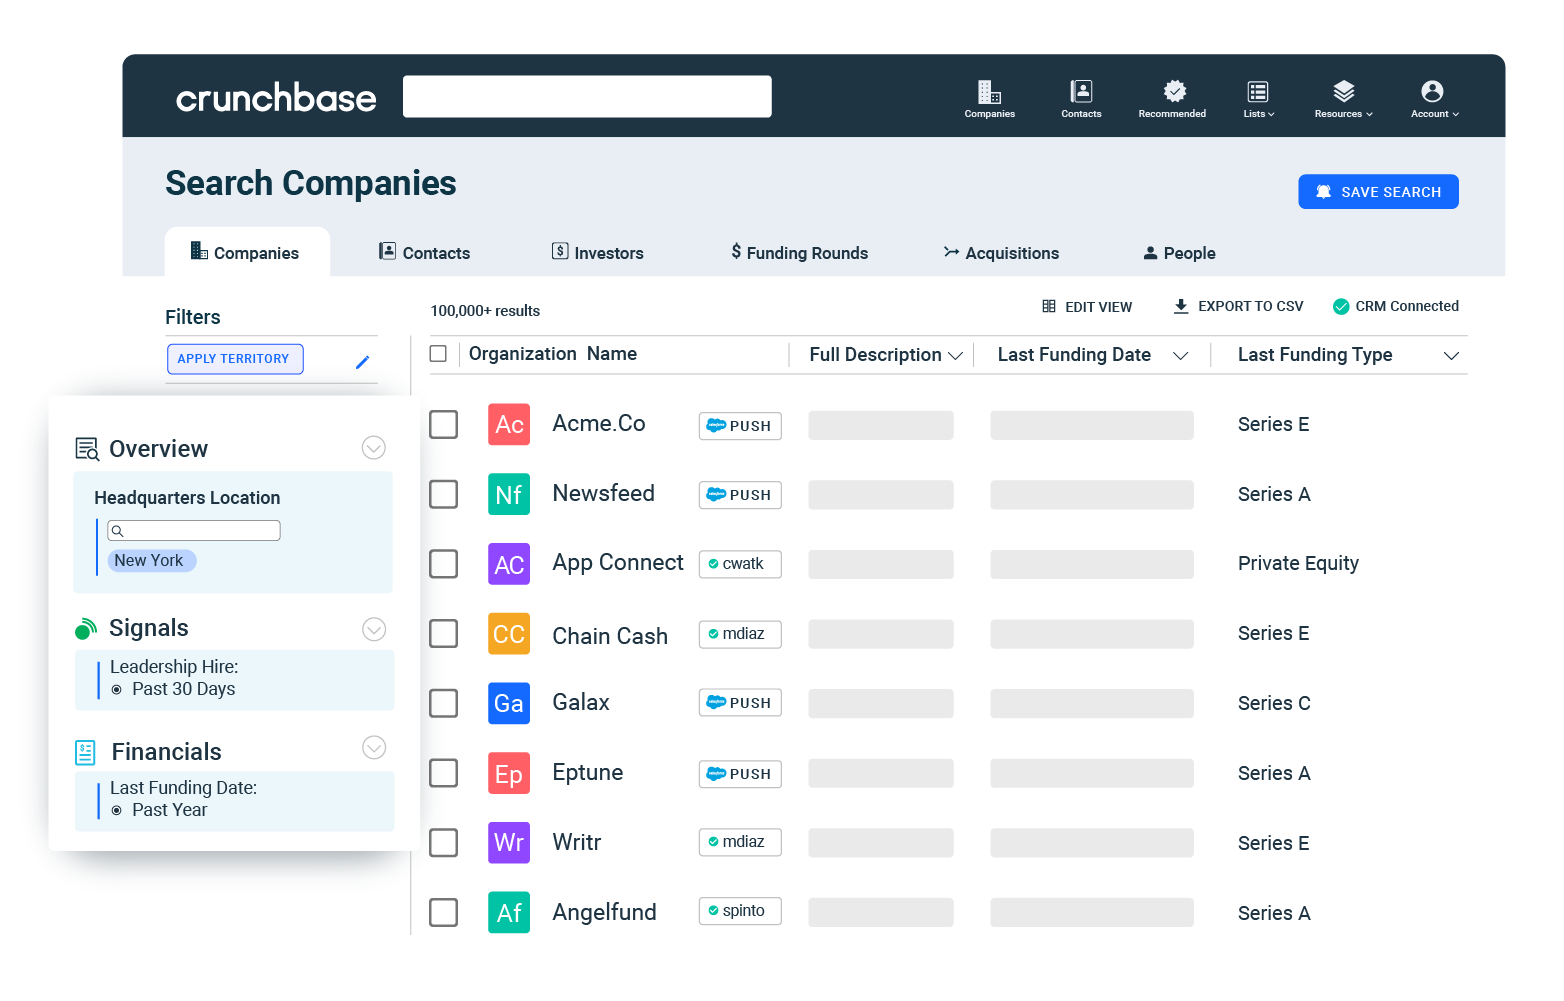 Effortlessly track companies and their funding information with Crunchbase.
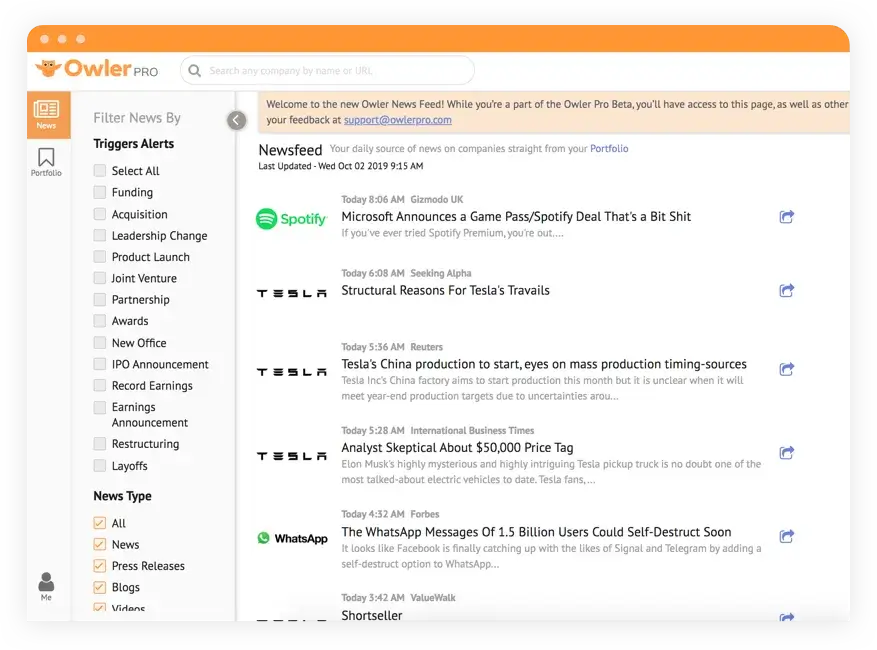 Access valuable market intelligence in realtime with Owler.
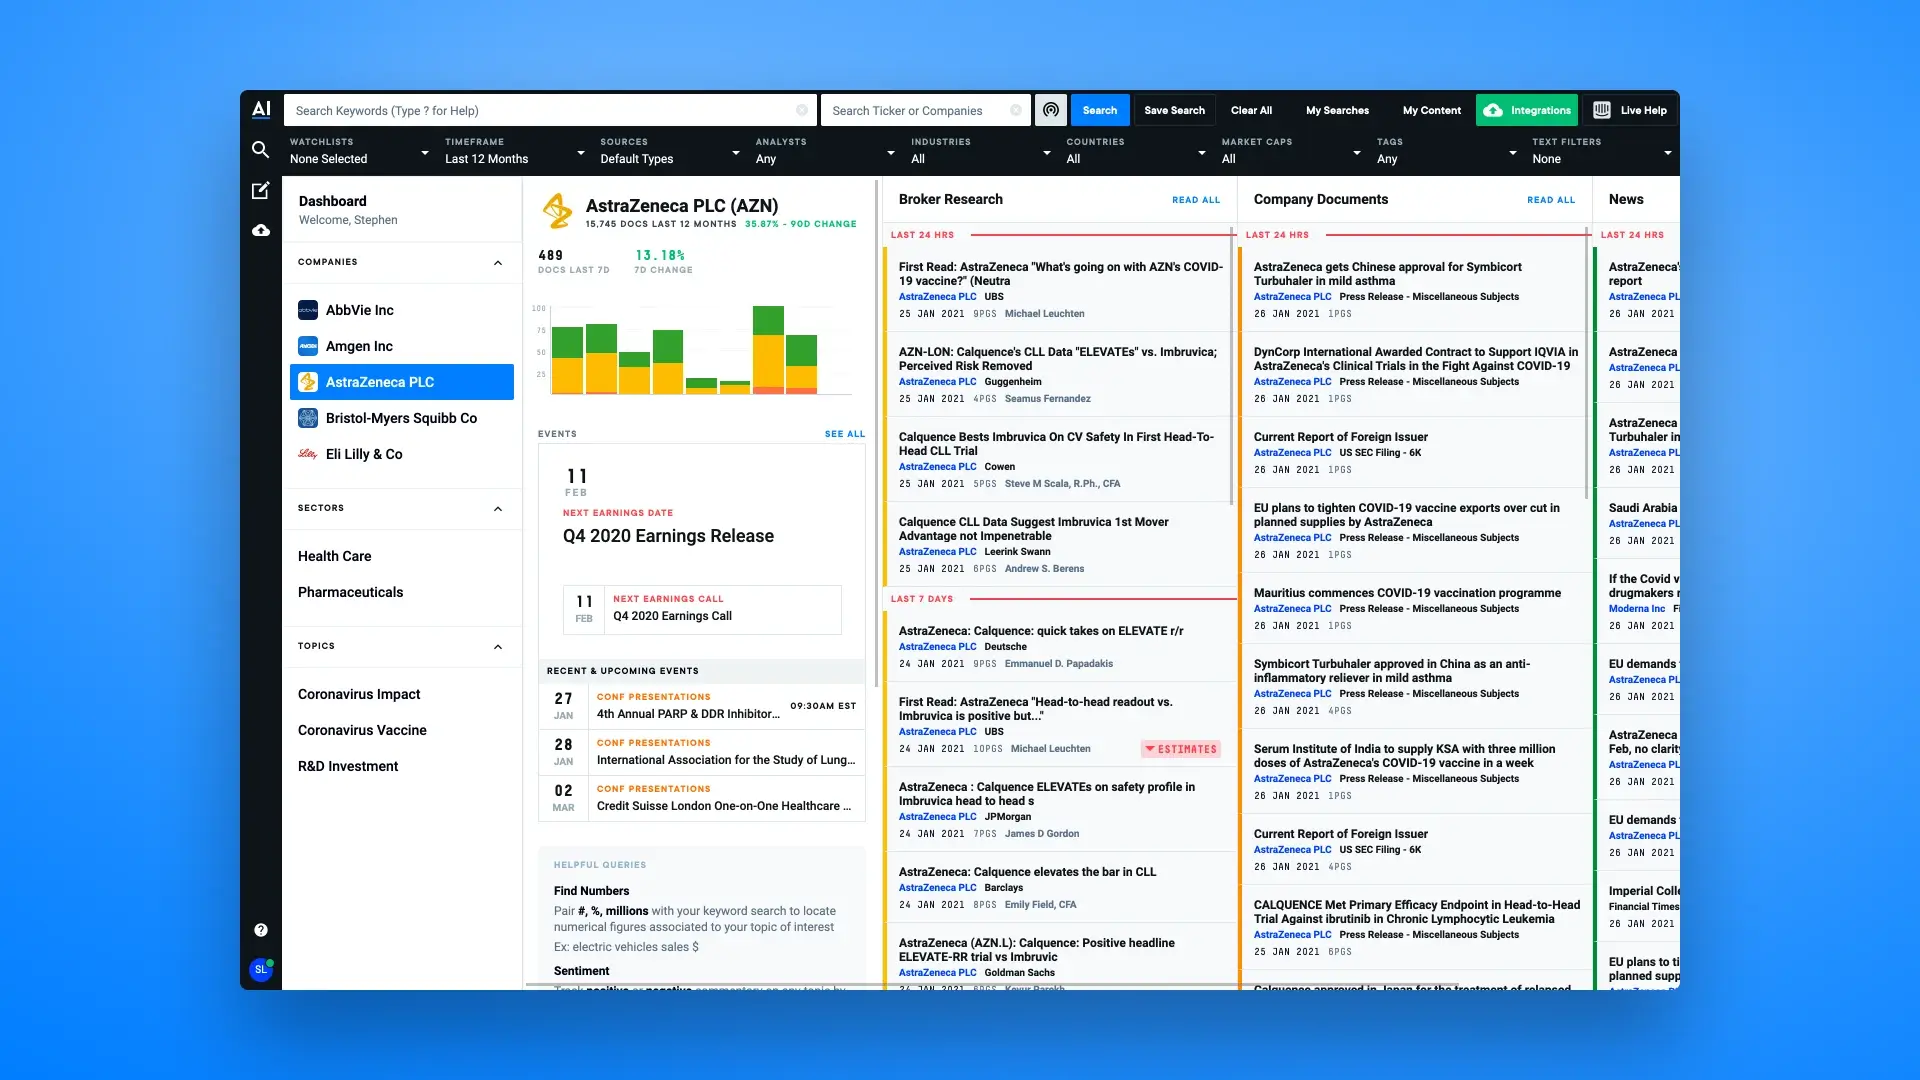 Know everything you need to know about your competitors, including their past and upcoming events, media coverage, and more with AlphaSense.
 Seamlessly see and track companies that visit your website with AroundDeal.
 Find everyone and anyone's email with ease through AroundDeal.
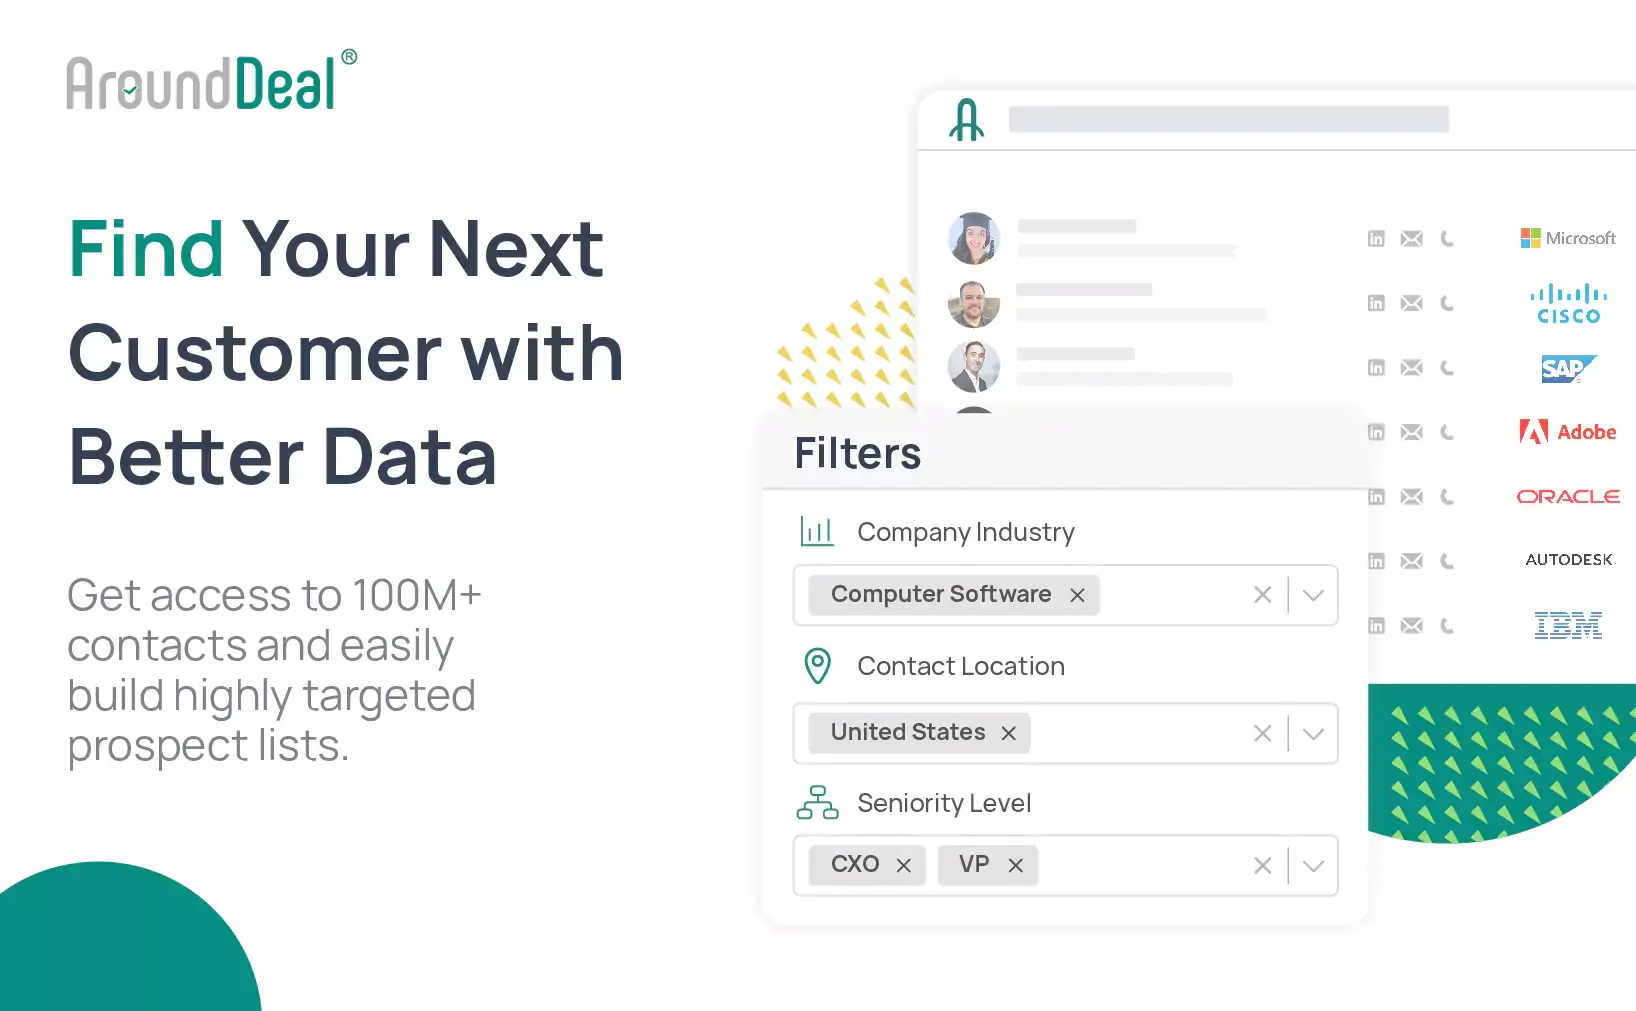 Effortlessly generate leads with AroundDeal's efficient lead generation tools.
 Efficiently target executives and other important prospects with Slintel.
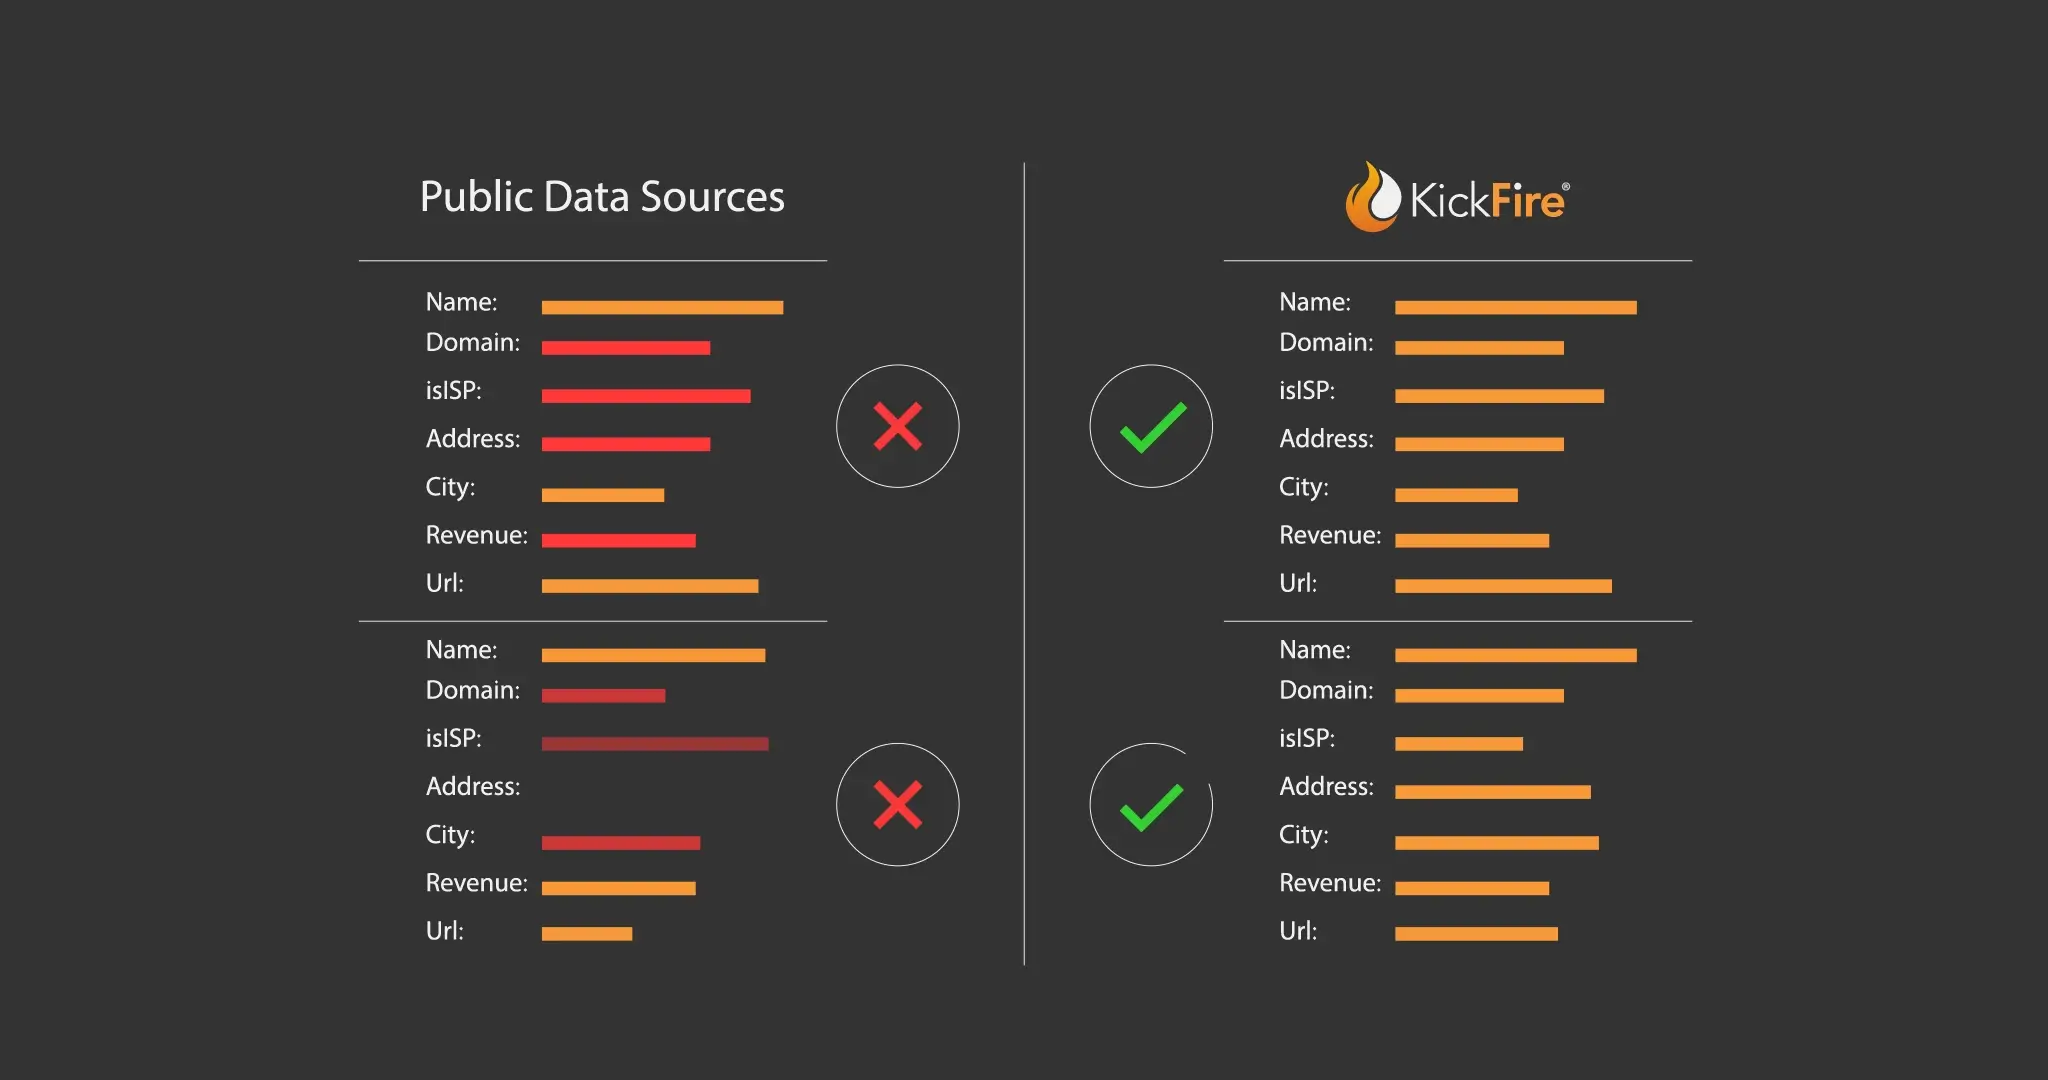 Always receive complete and detailed market data with KickFire.
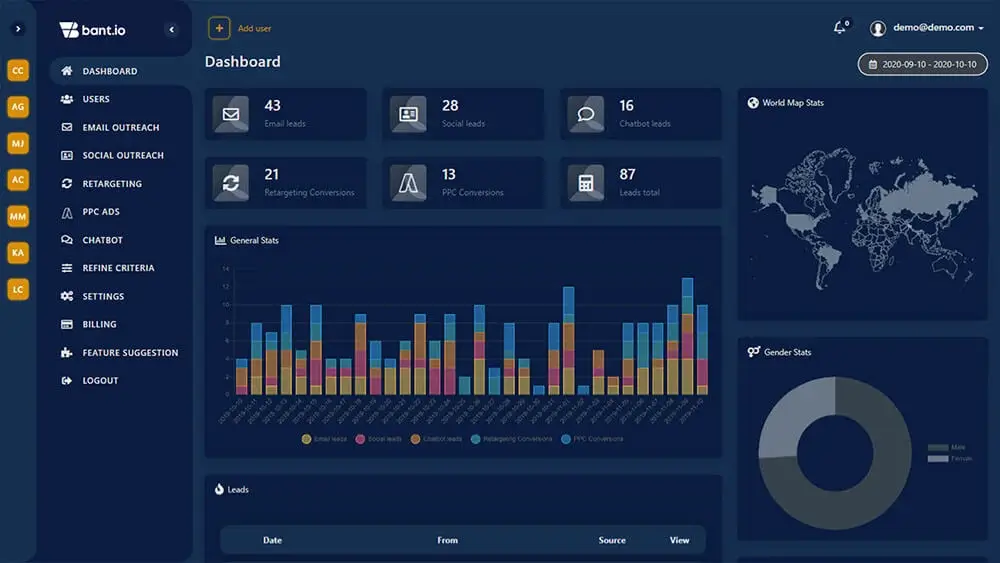 Enjoy effortless market data collection and monitoring with bant.io.
 Set up campaigns and sit back as bant.io automatically sends your emails.
 Track companies' statistics with ease through TAMI.
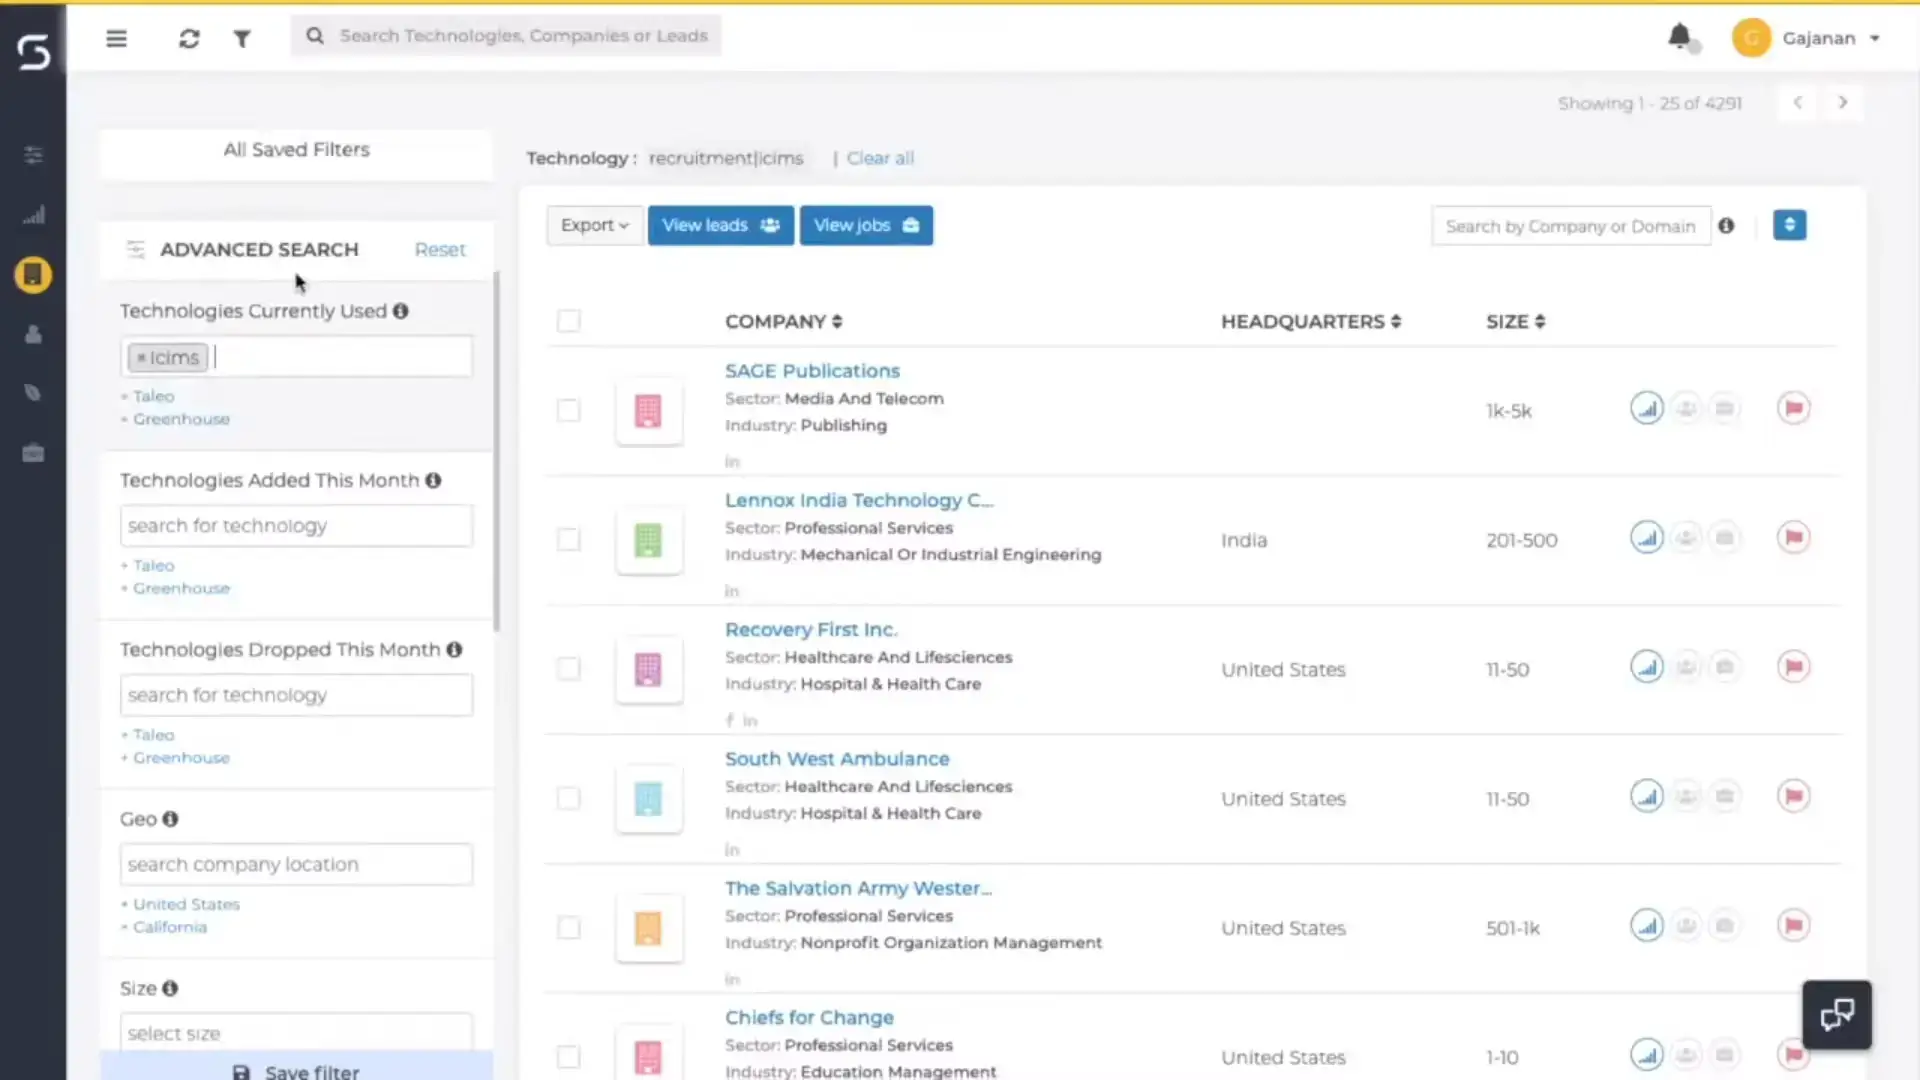
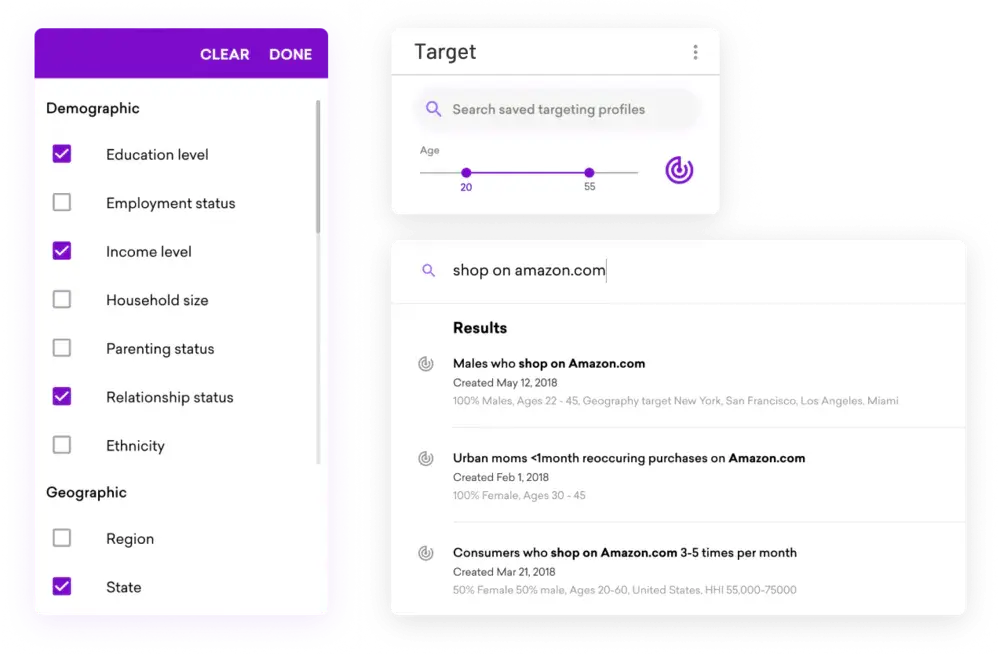
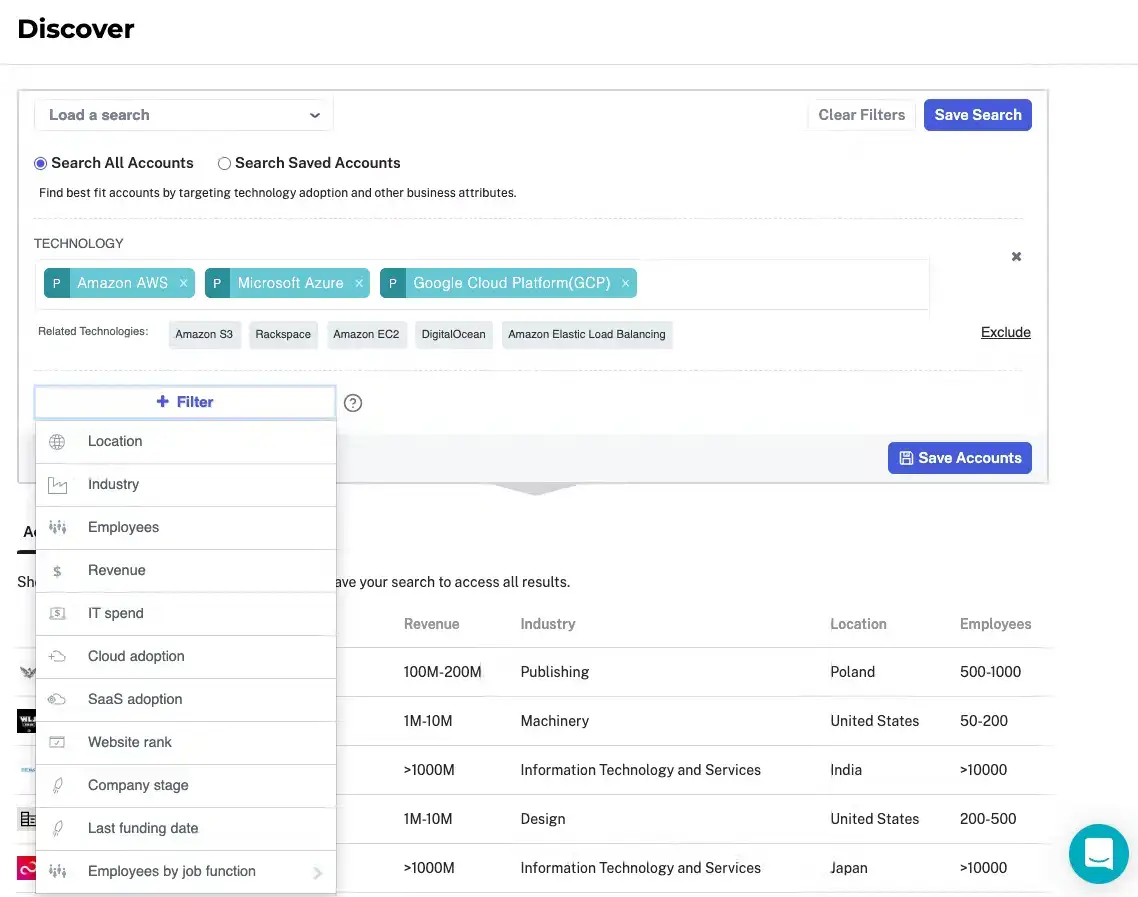 Quickly find companies that match your preferences and save your searches with Enlyft.
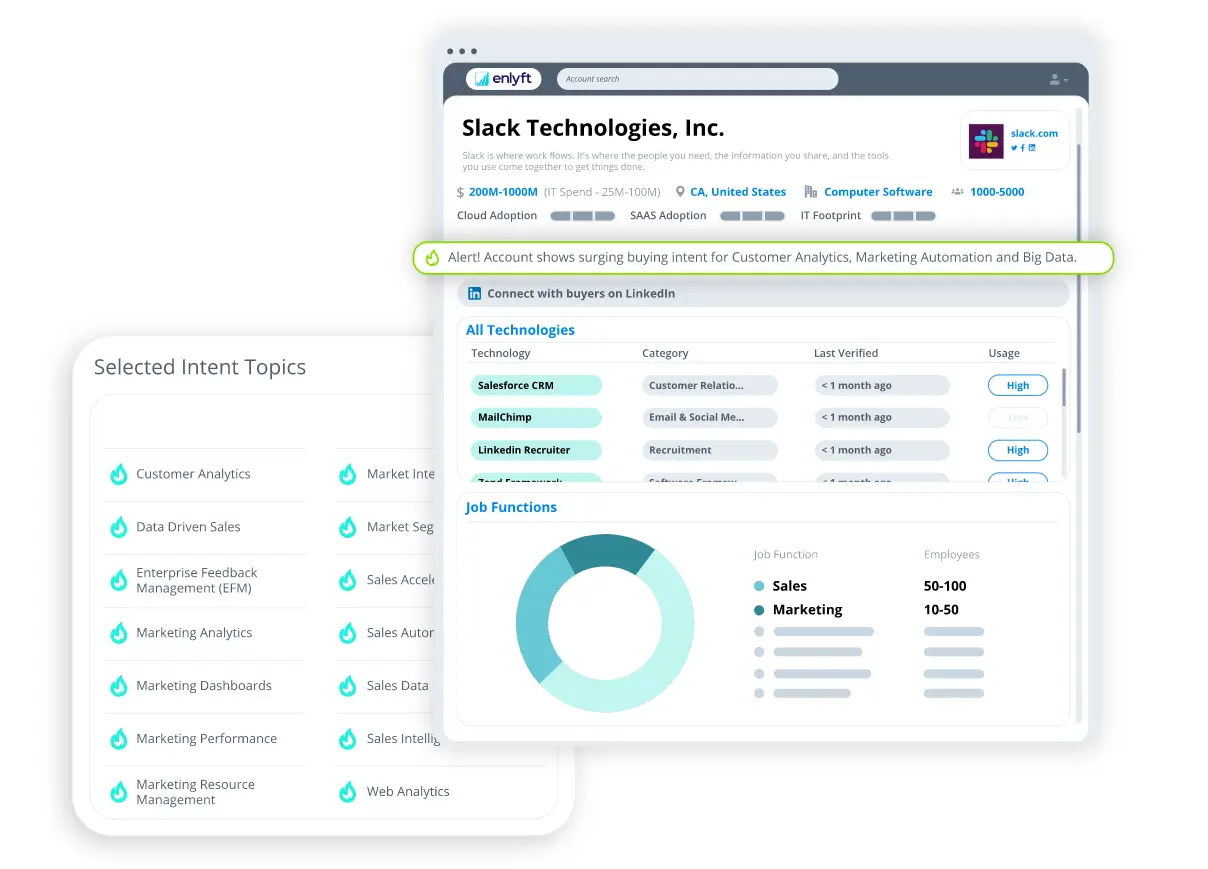 Find out what your customers look for through Enlyft's surging interest monitor.
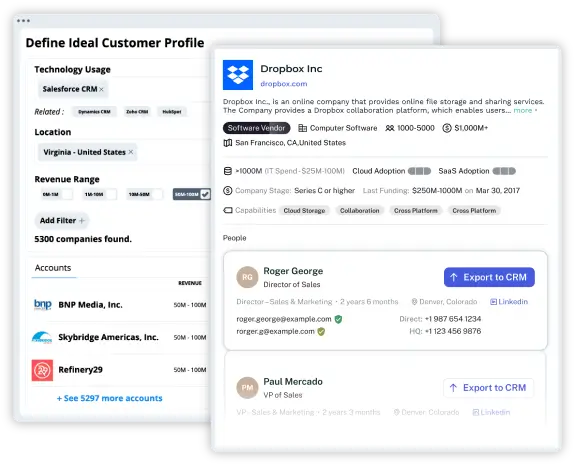 Create target profiles and seamlessly segment your results with Enlyft.
 Where do consumer sentiments currently lie in the market? Find out through Echobot!
 Easily integrate Echobot with other apps through its open API feature!
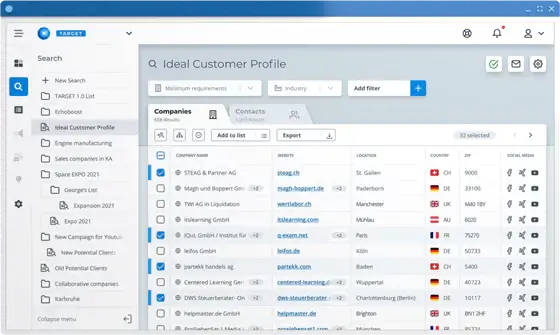 Create ideal customer profiles and easily watch them with Echobot's advanced search function.
 Monitor customer sentiment and reviews in realtime with Echobot!
 Easily target prospects and more with Suzy!
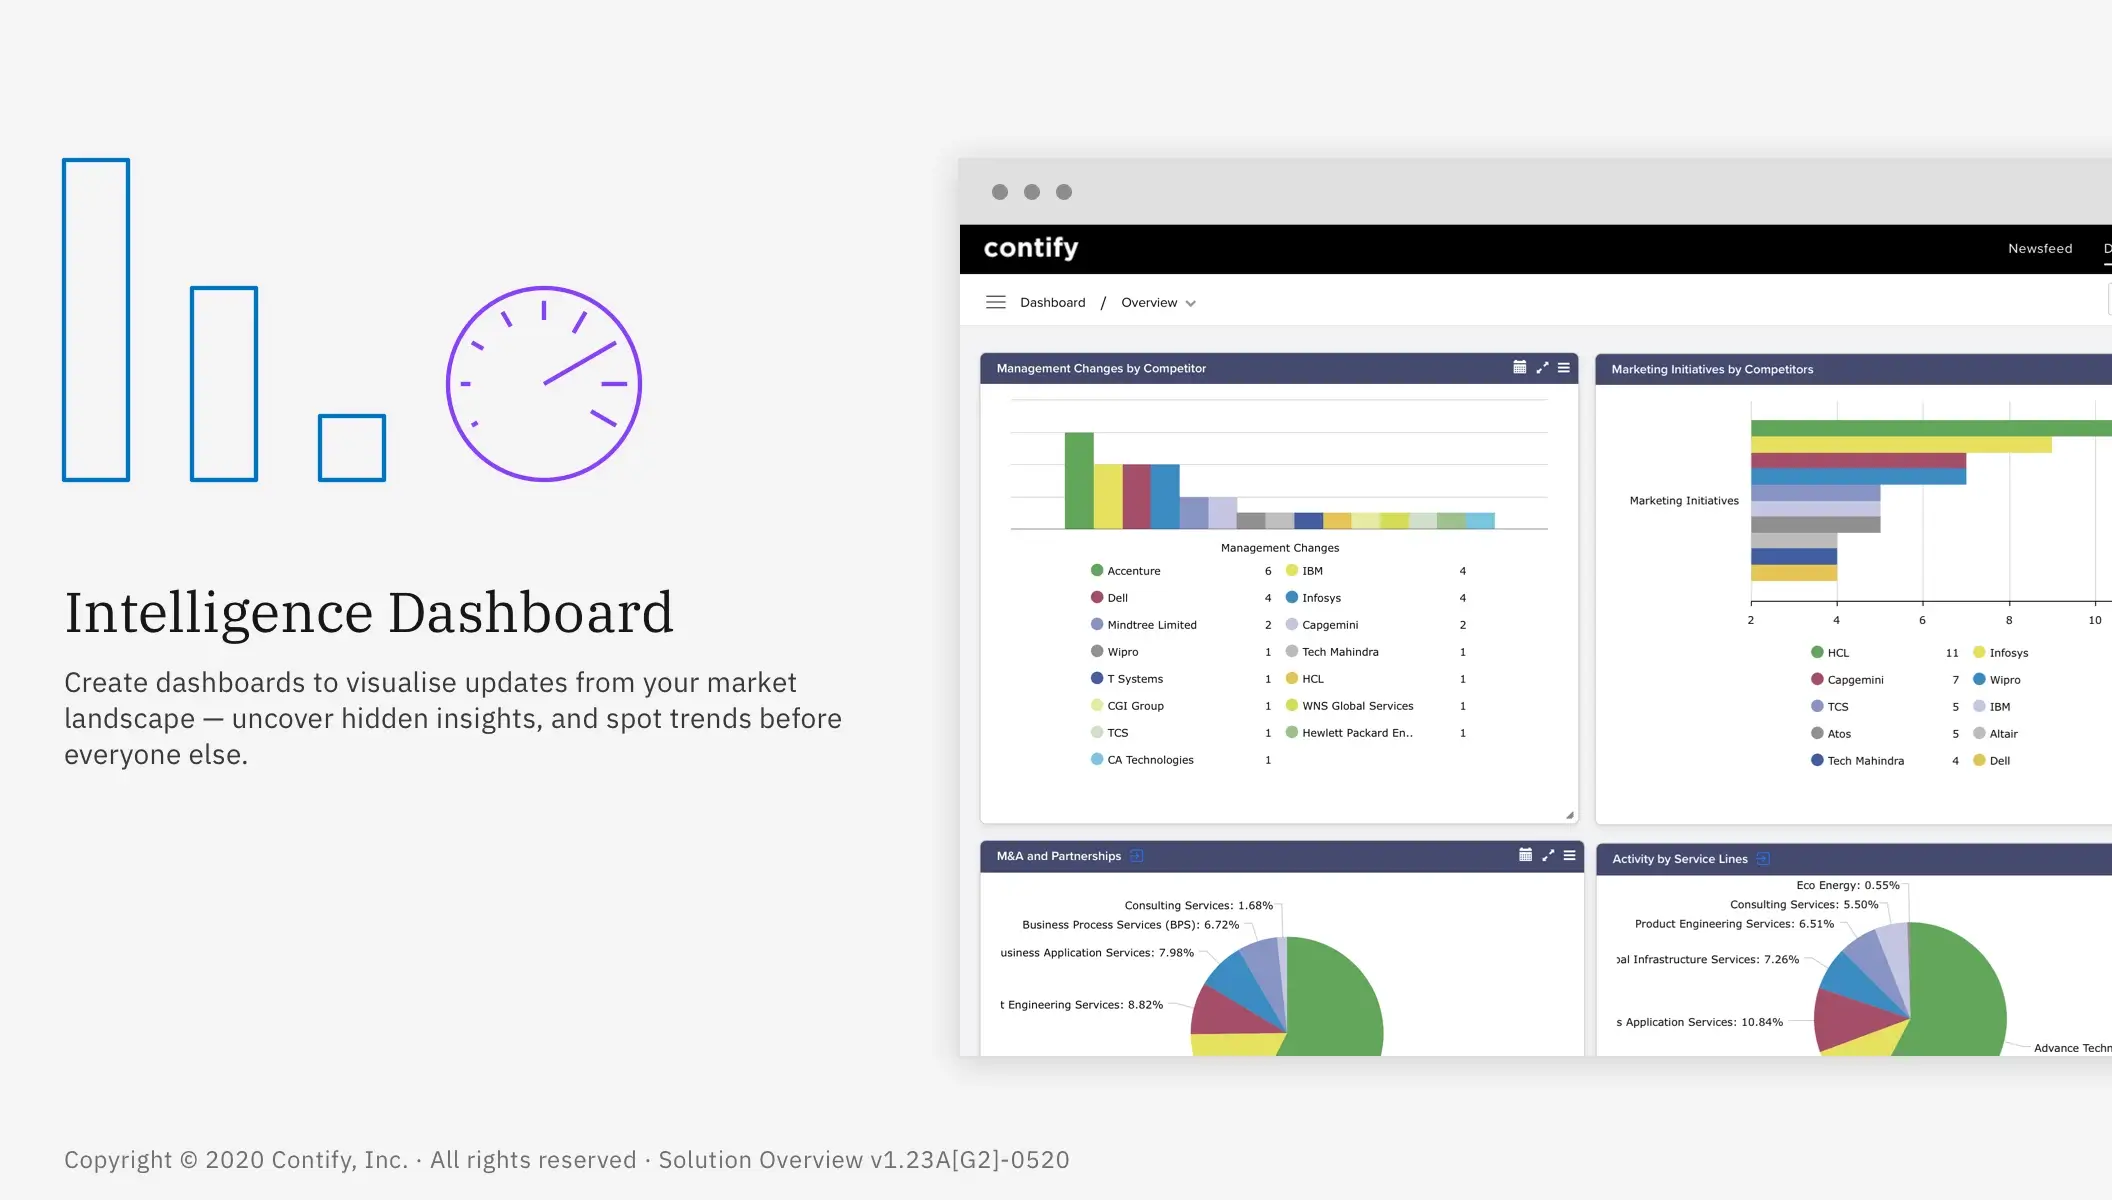 With Contify, you can benefit from everything you need to have in a market intelligence software.
 Great market intelligence data relies on social media now, and Contify knows it.
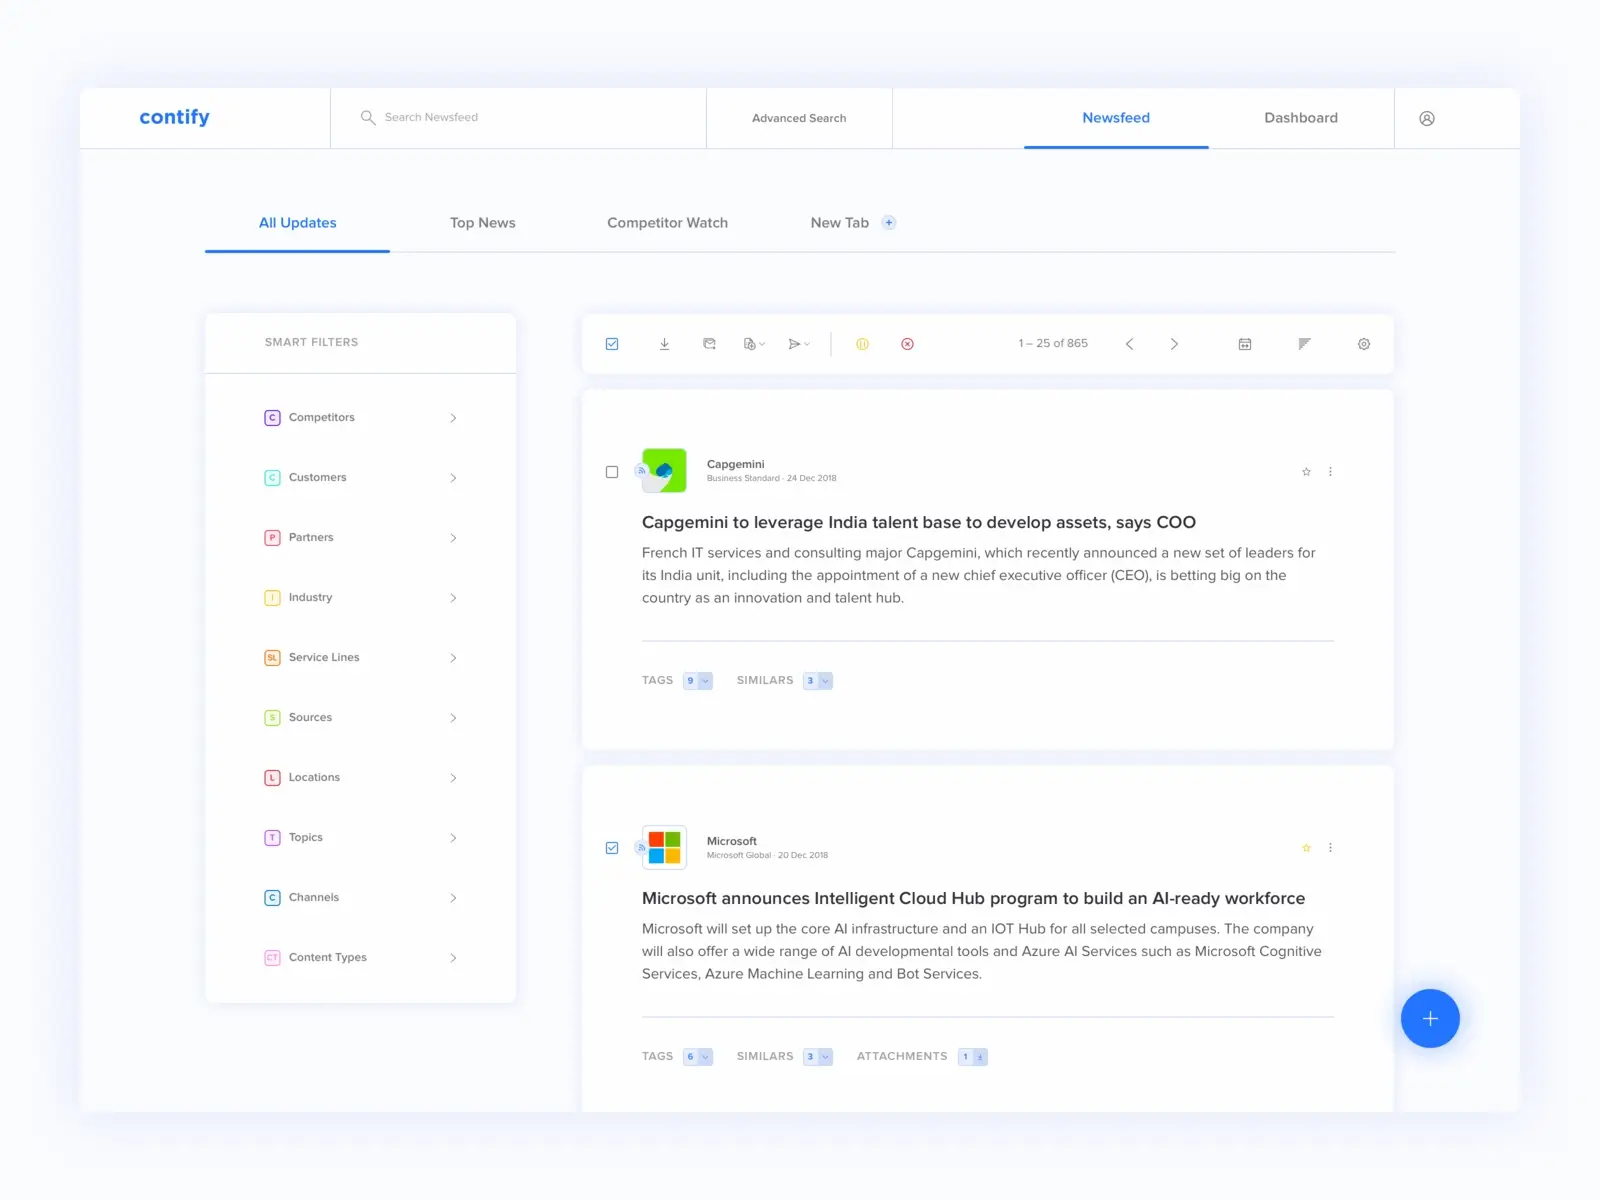 Discovery and curate content with ease and confidence through Contify.
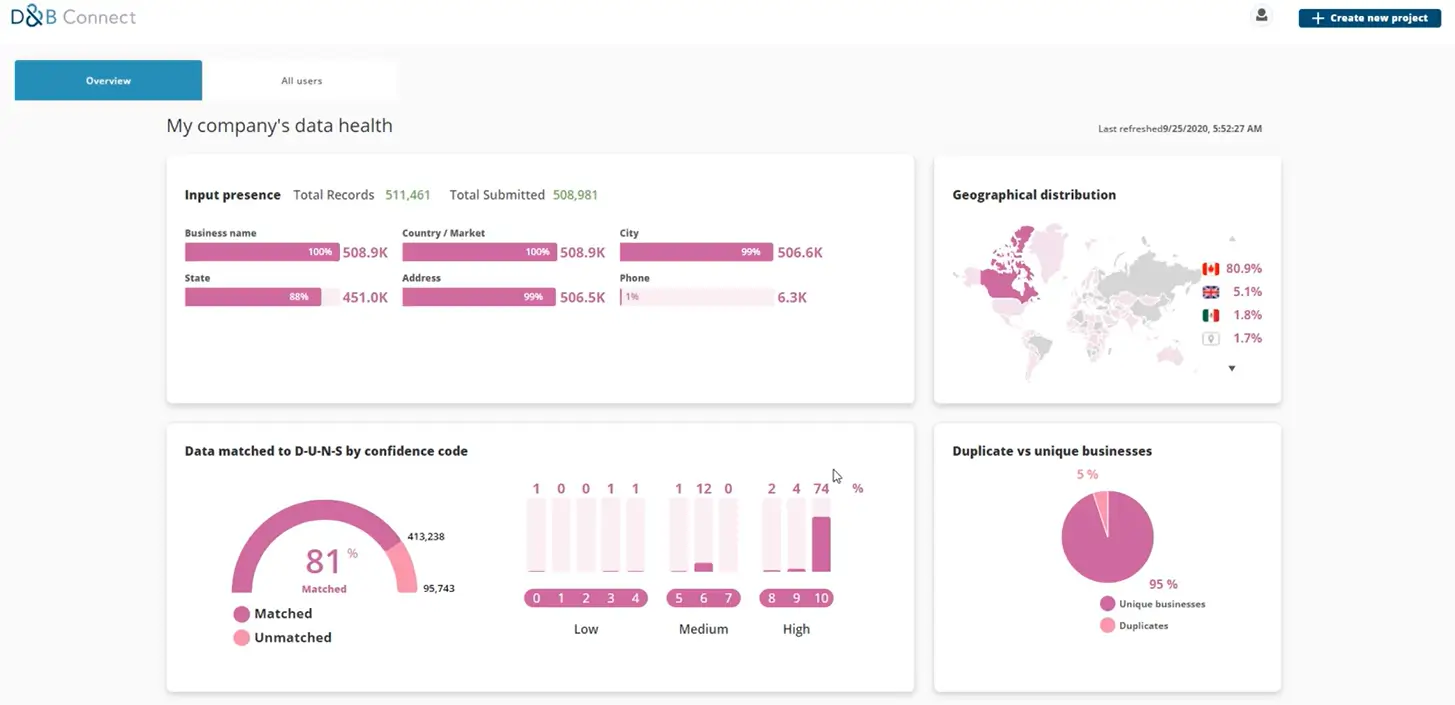 Monitor your company's health and other targets with D&B Connect.
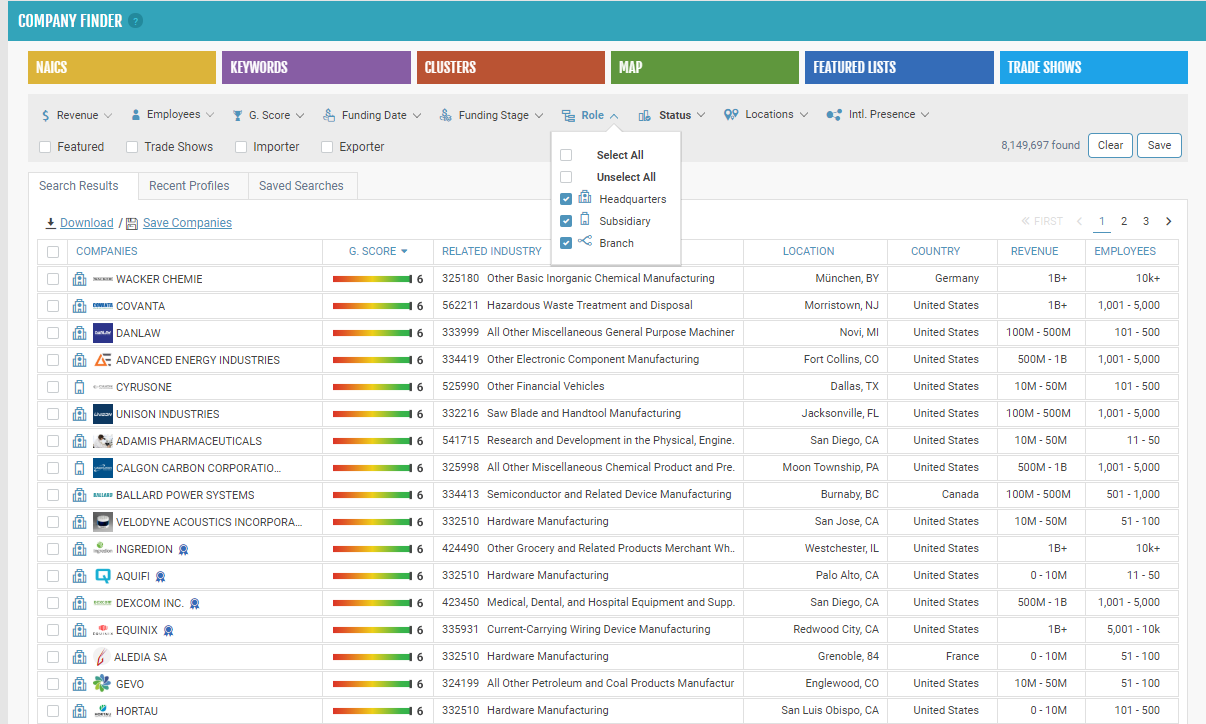 Easily find companies, see their growth scores, and more through Gazelle.ai.
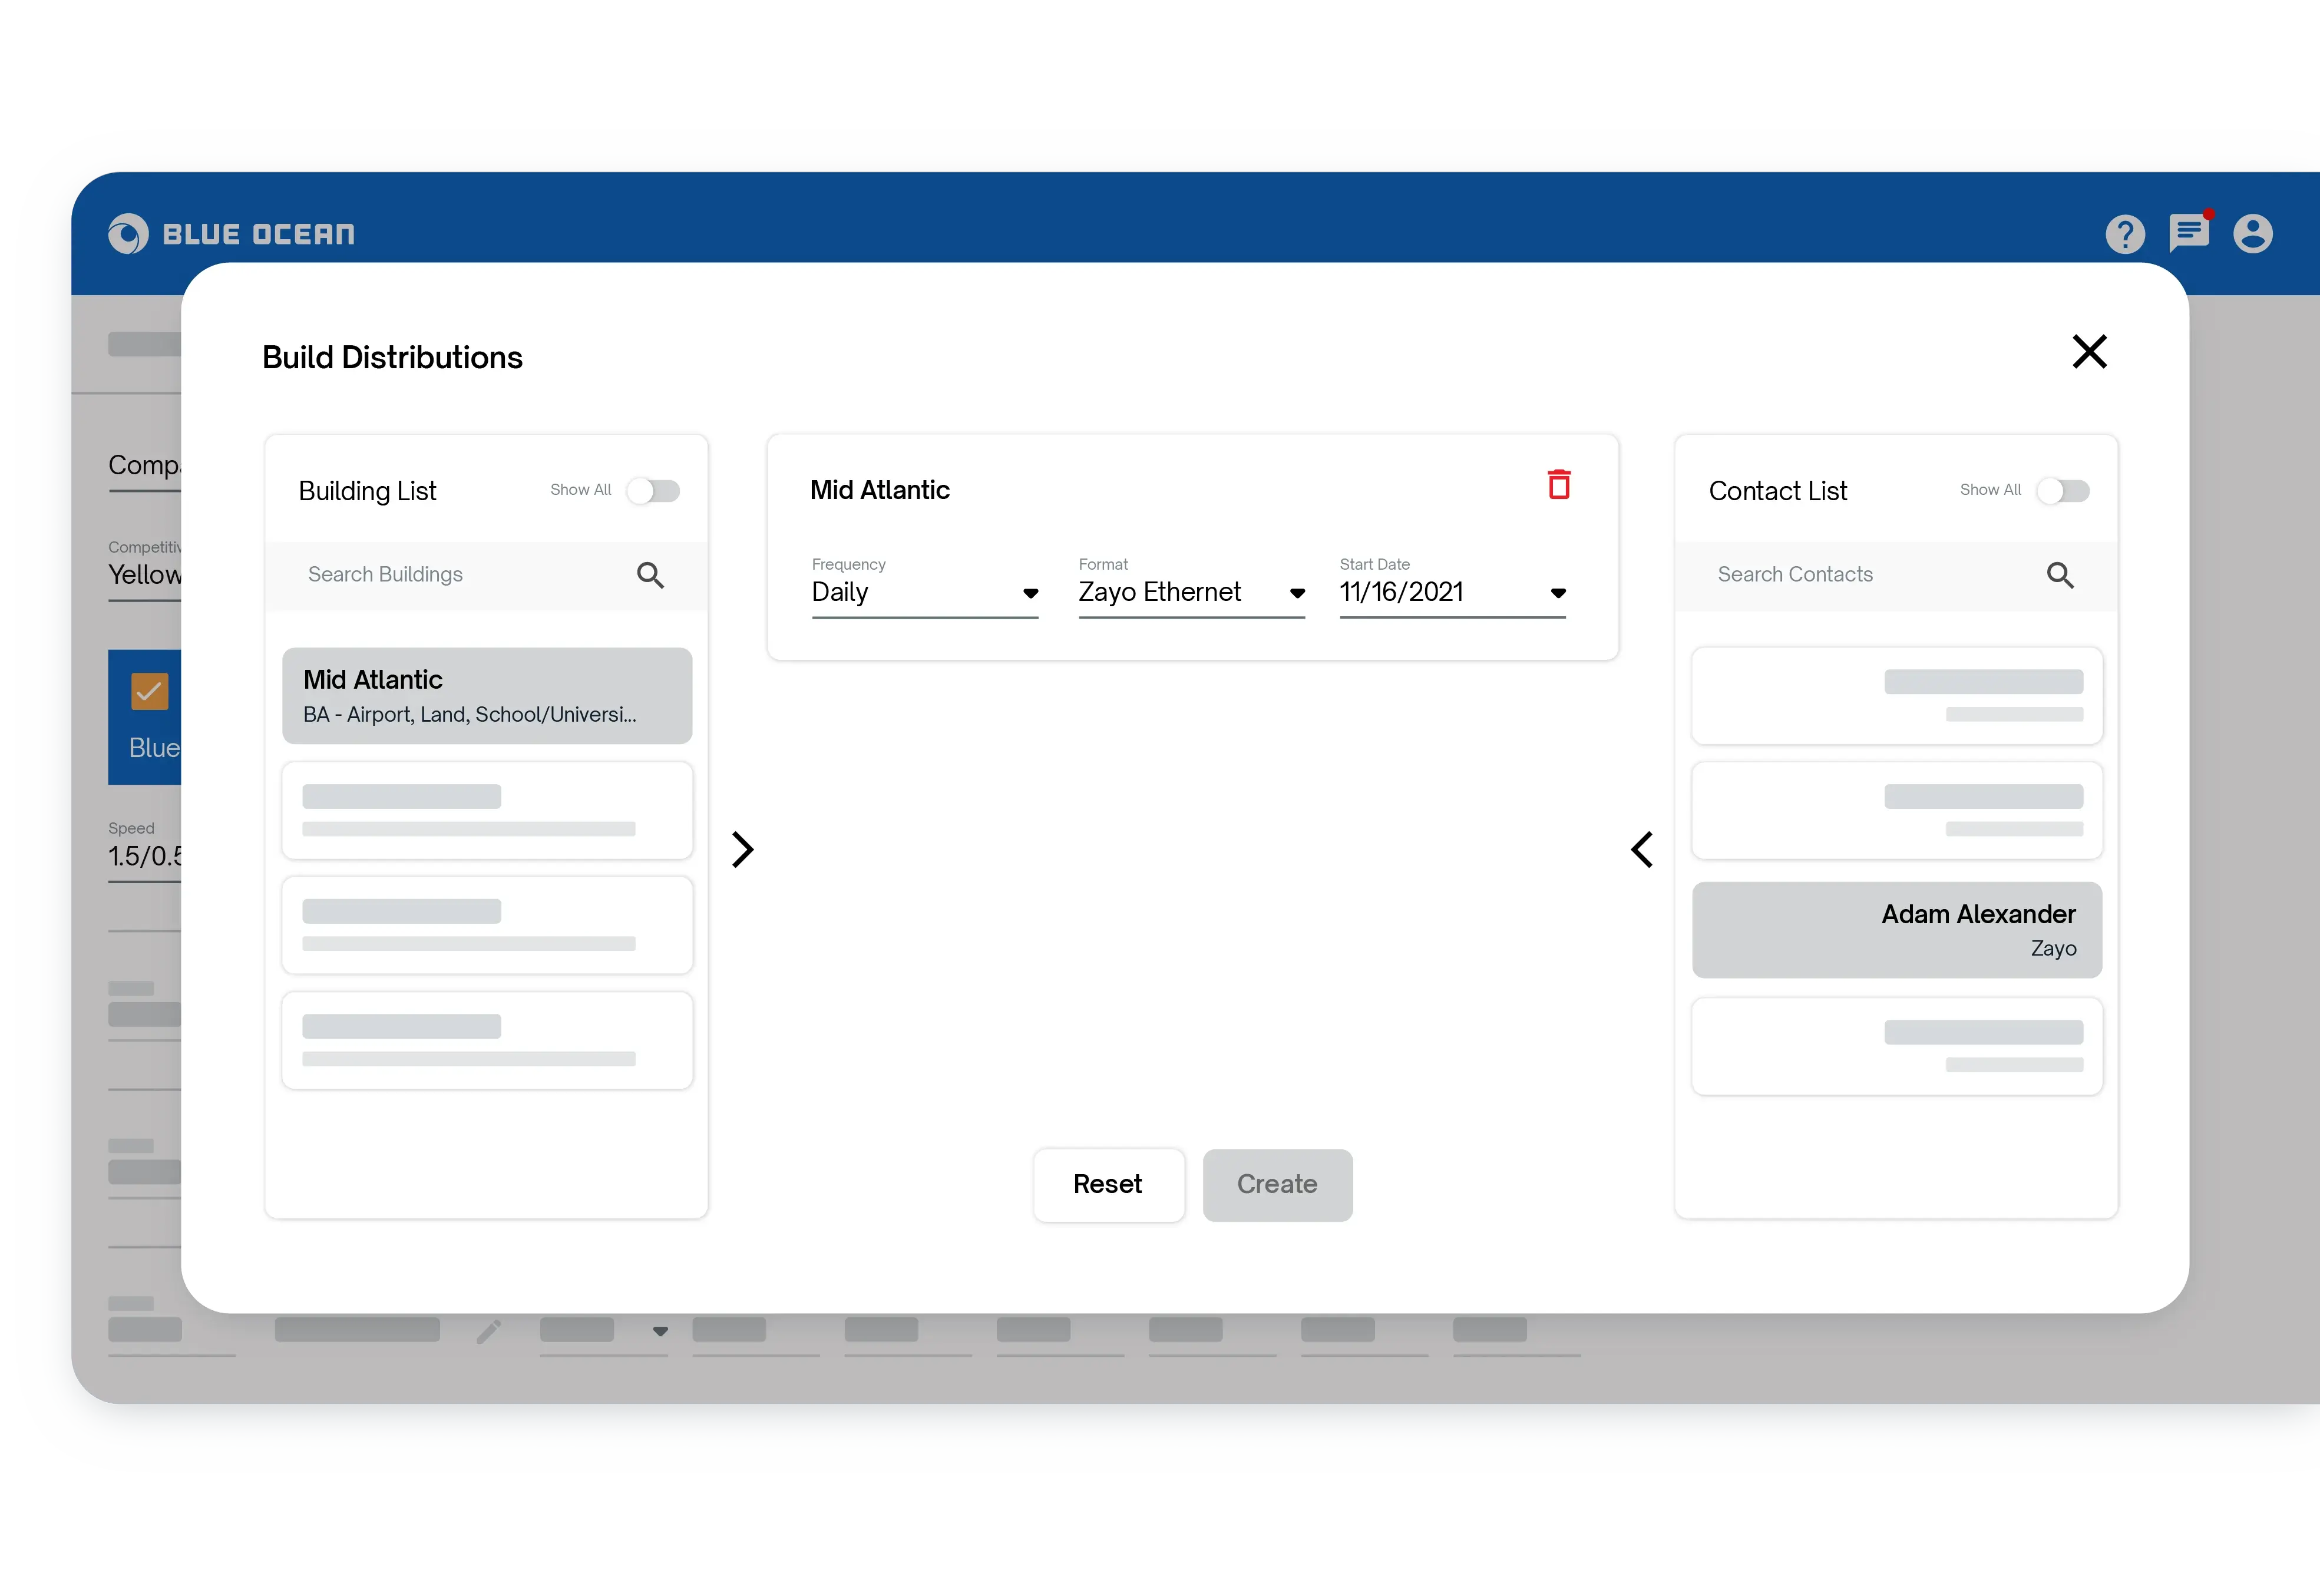 Gather intelligence and seamlessly build distribution lists with Connectbase.
 Access news from everywhere and create useful reports with ease through Factiva.
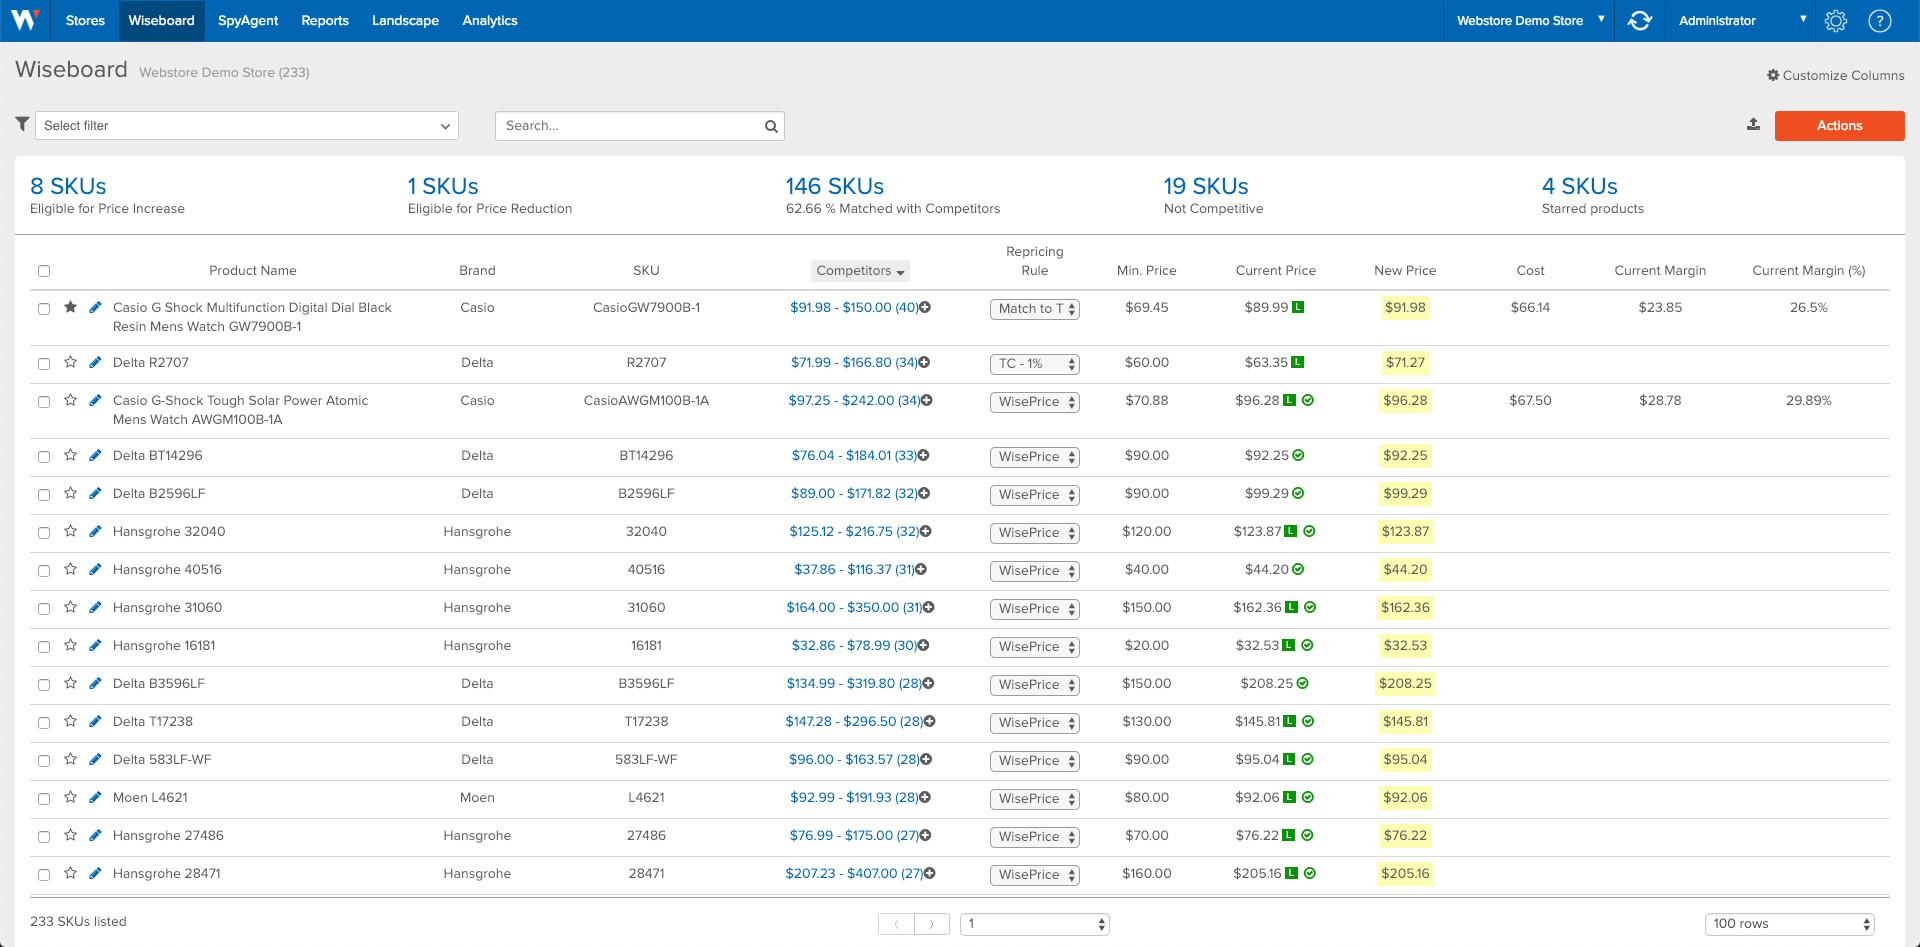 Easily track violations, monitor shelf positions, and create a customized dashboard with Wiser Solutions.
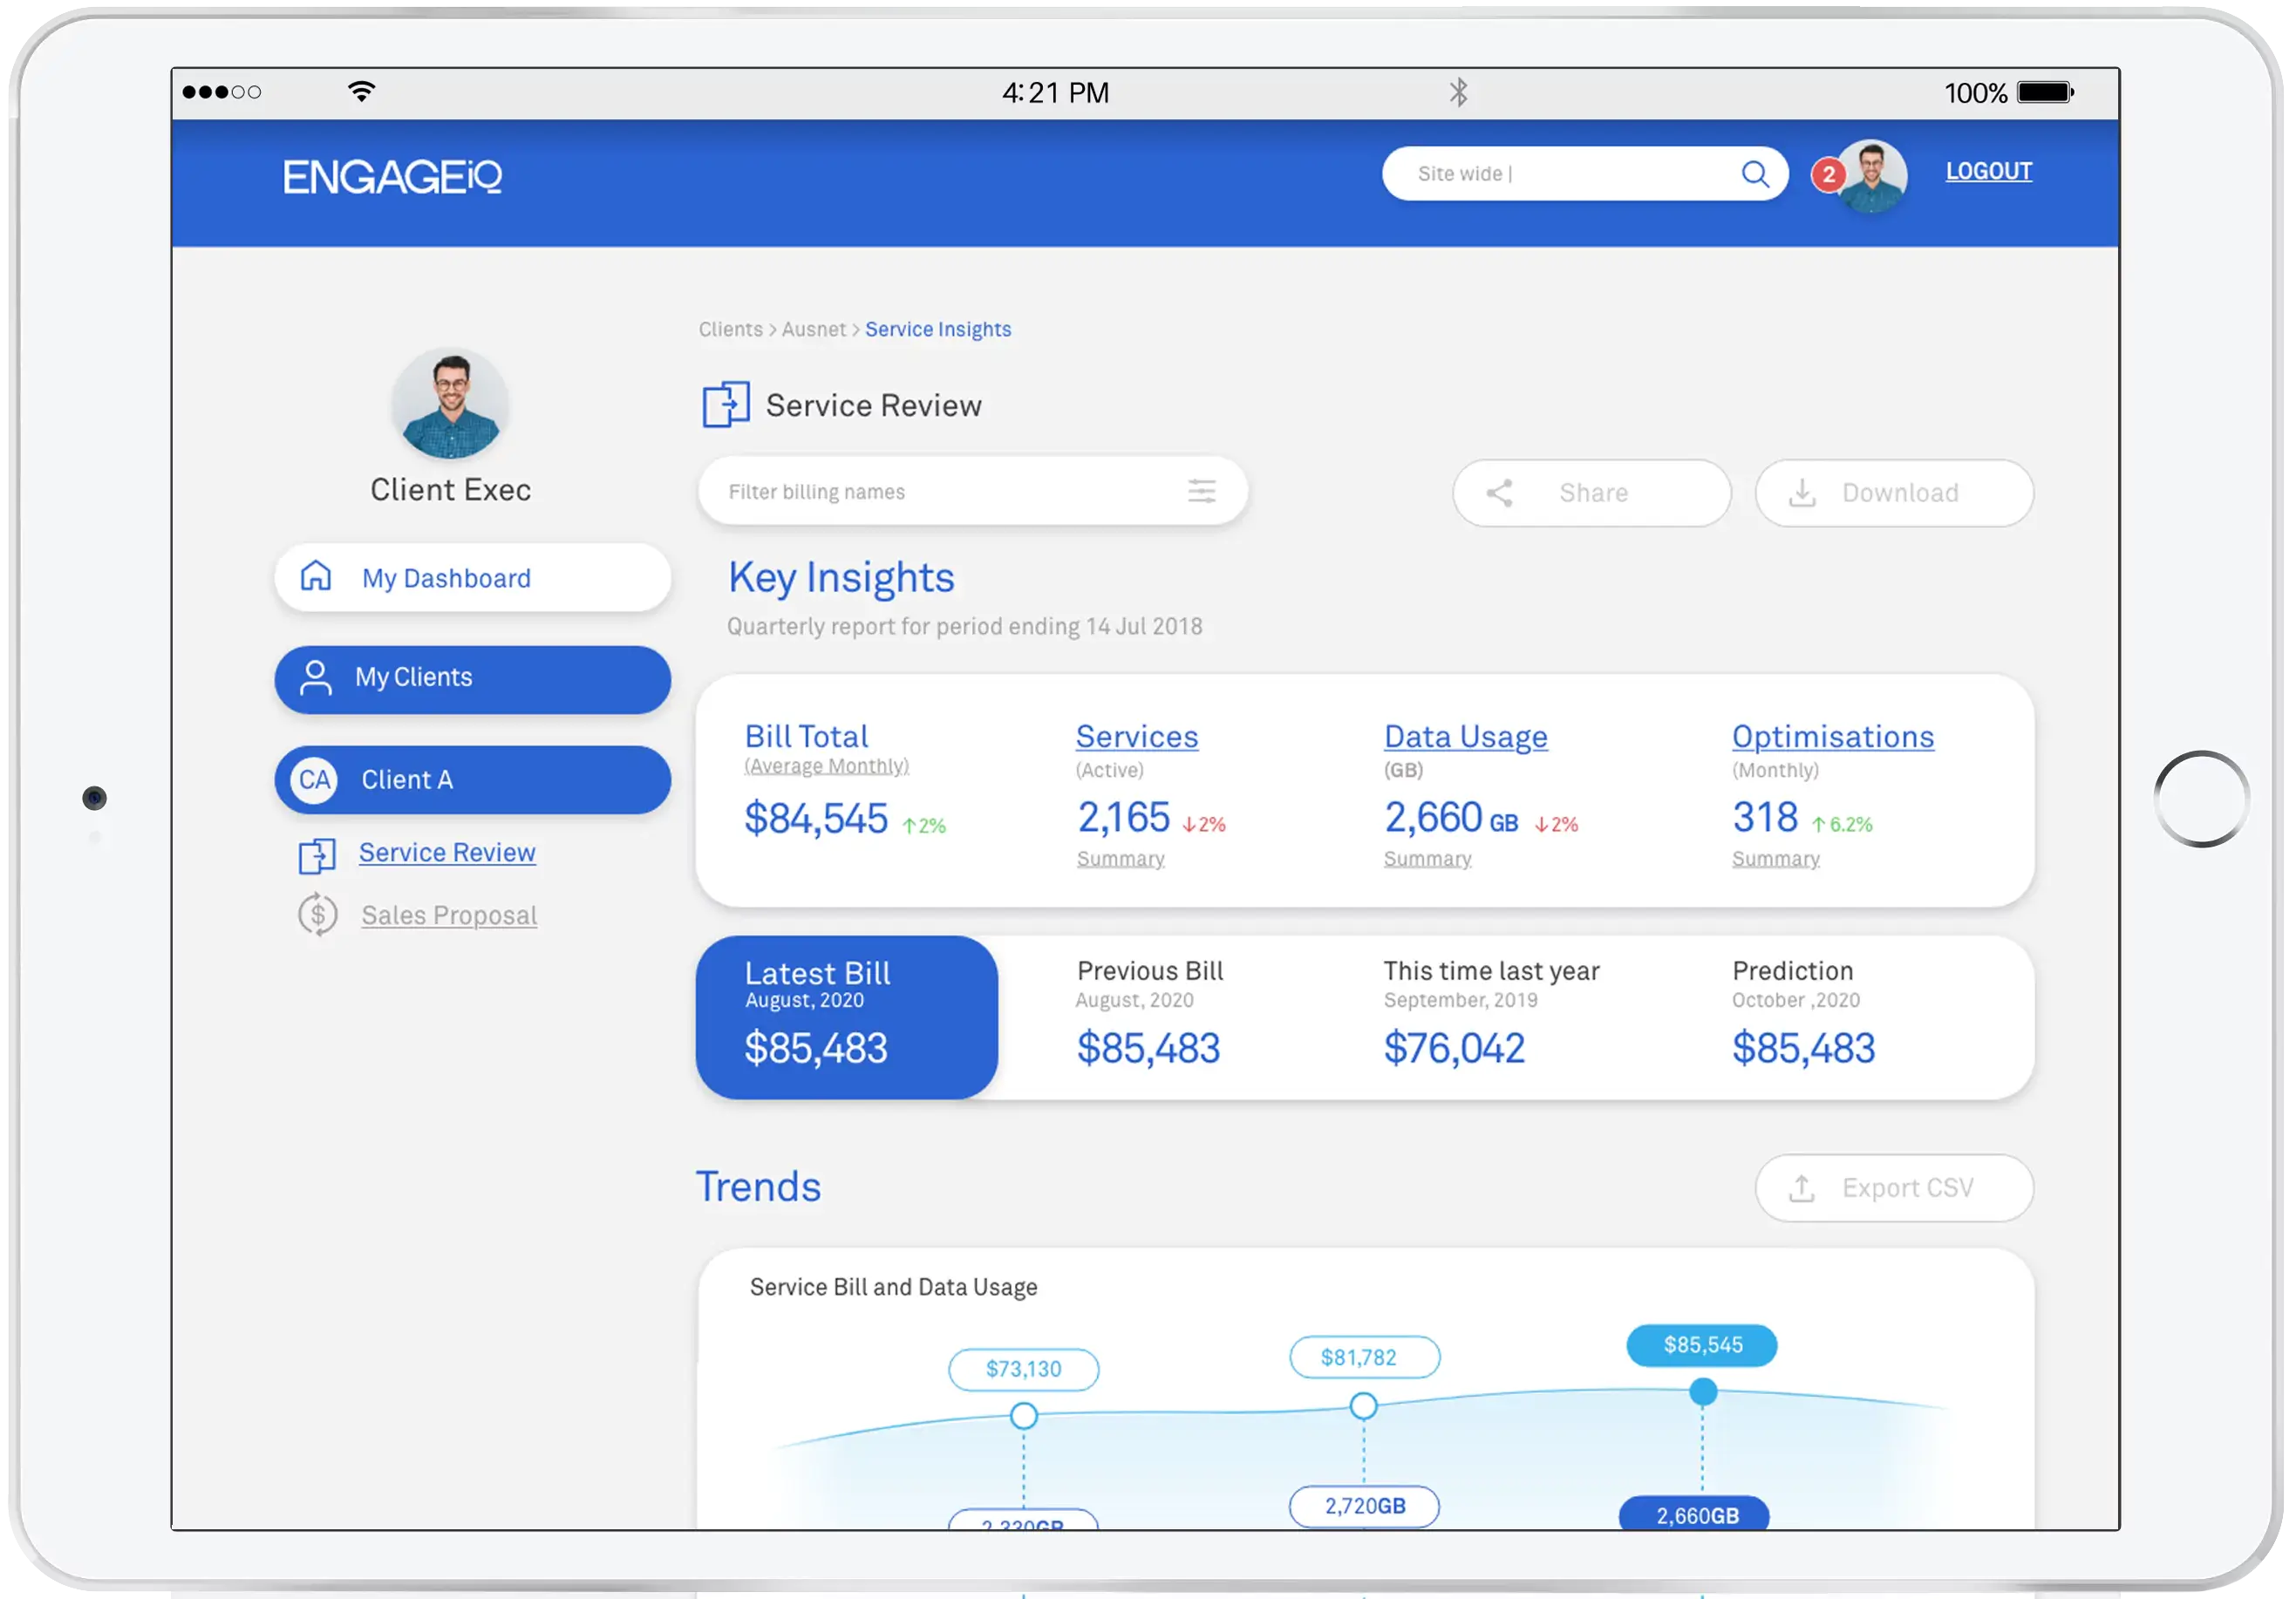 Curious about your competitors? Easily view detailed insights about them with EngageIQ!
 Watch your leads in realtime, score their engagements, and segment them as needed with LeadSift.
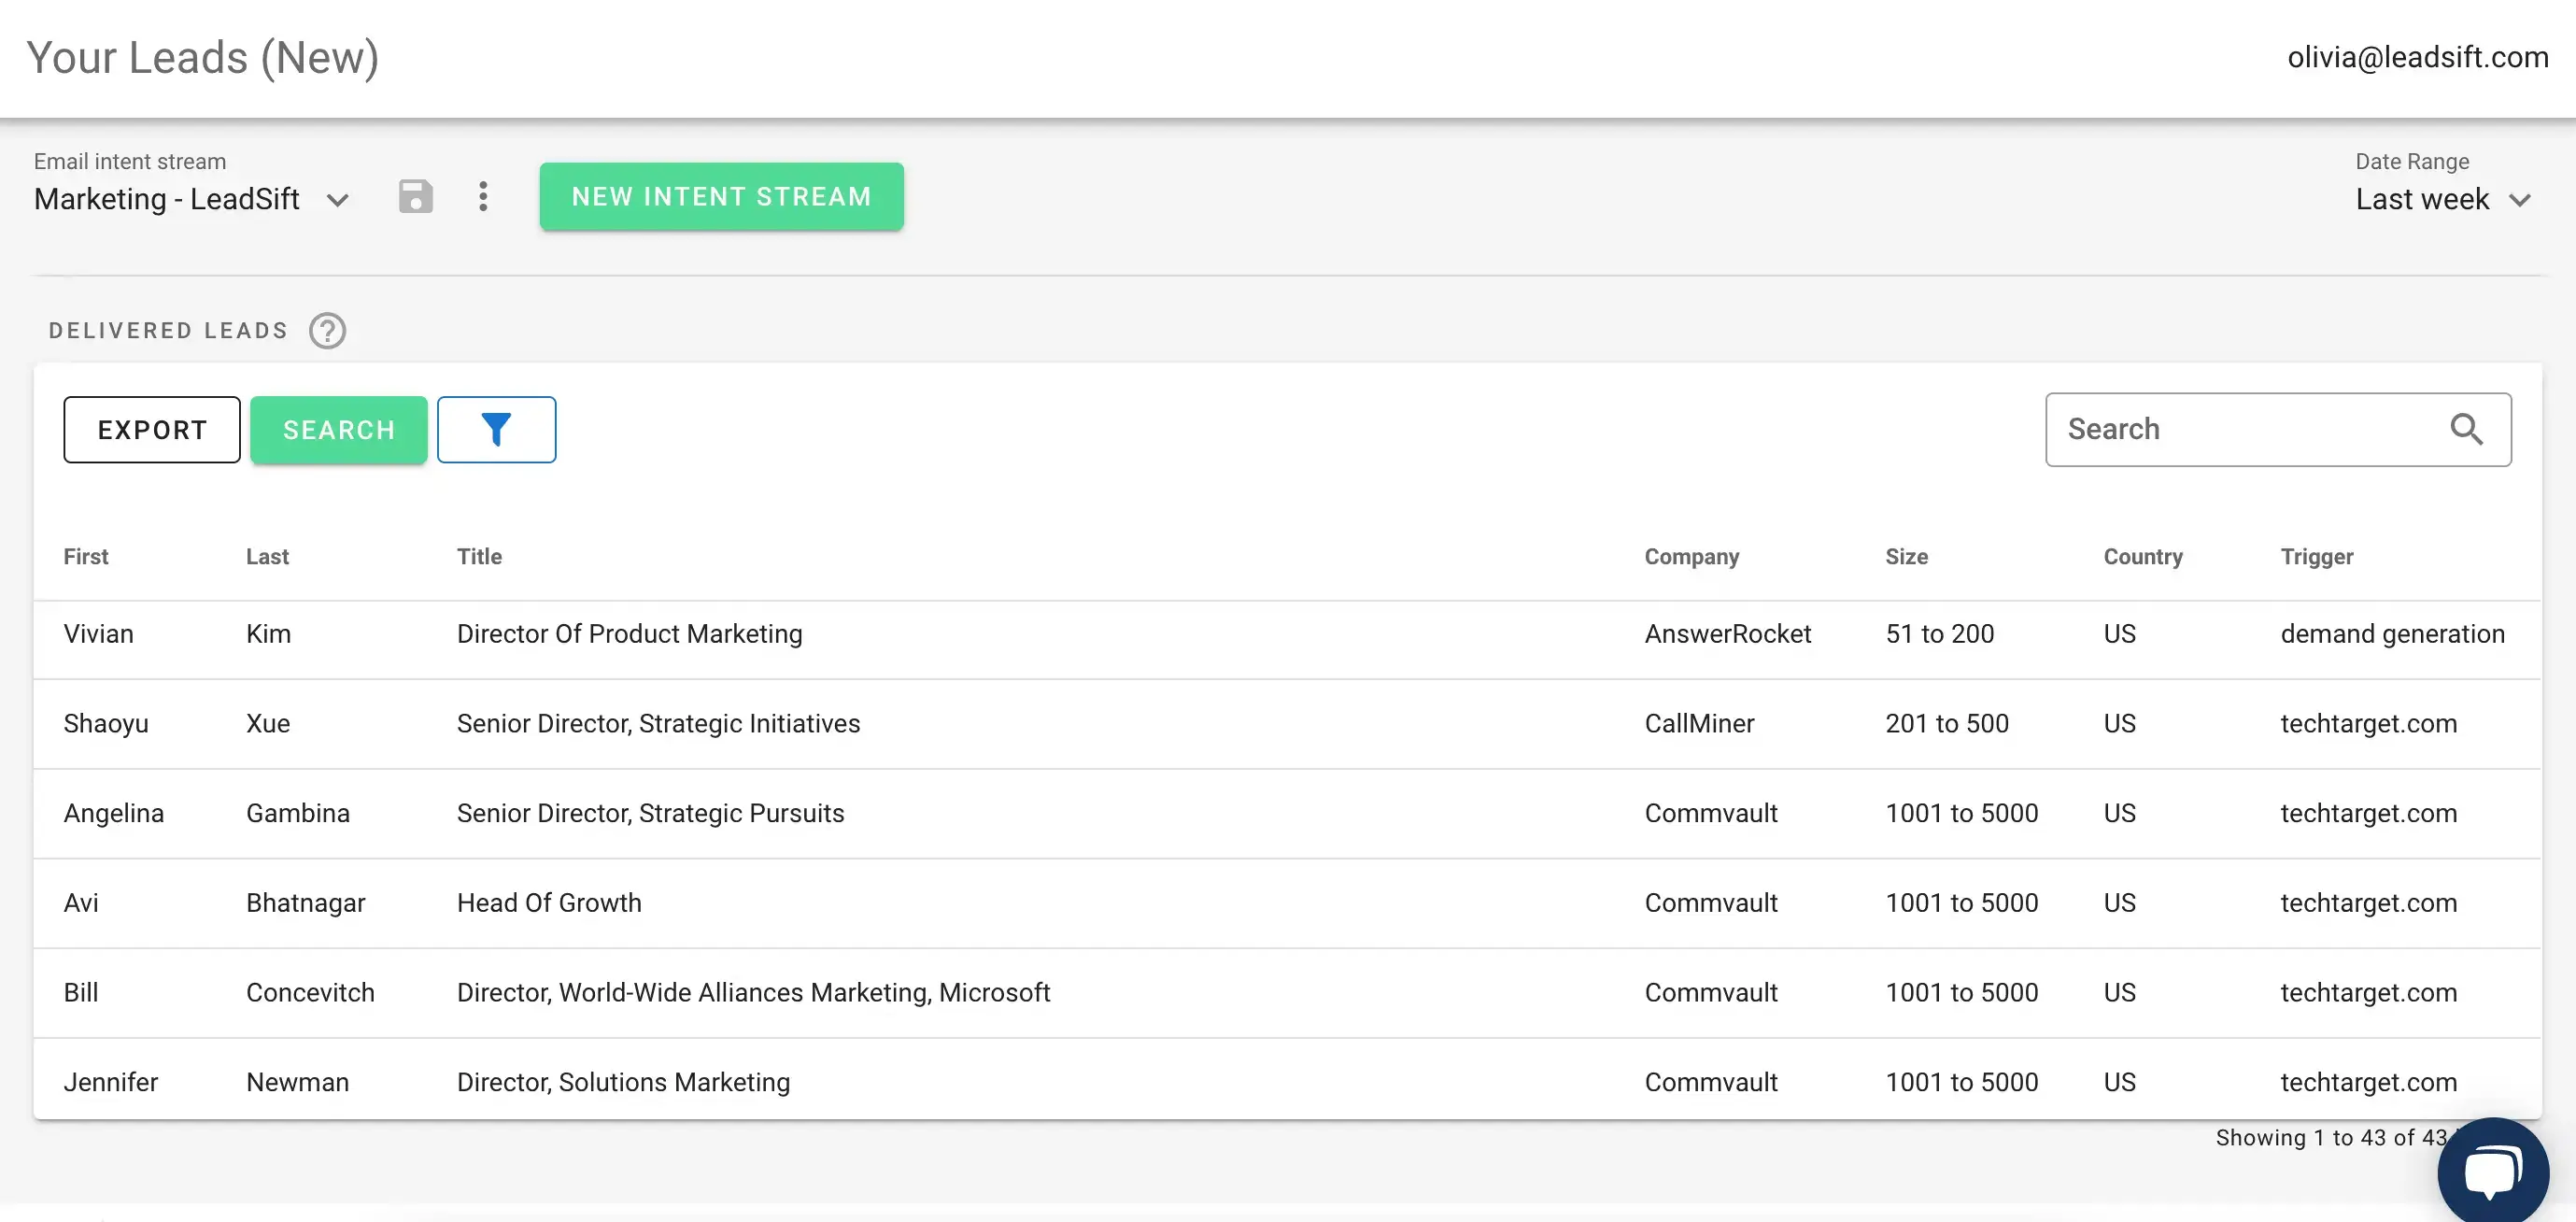 Effectively target your market and avoid being overwhelmed with LeadSift's lead segmentation function.
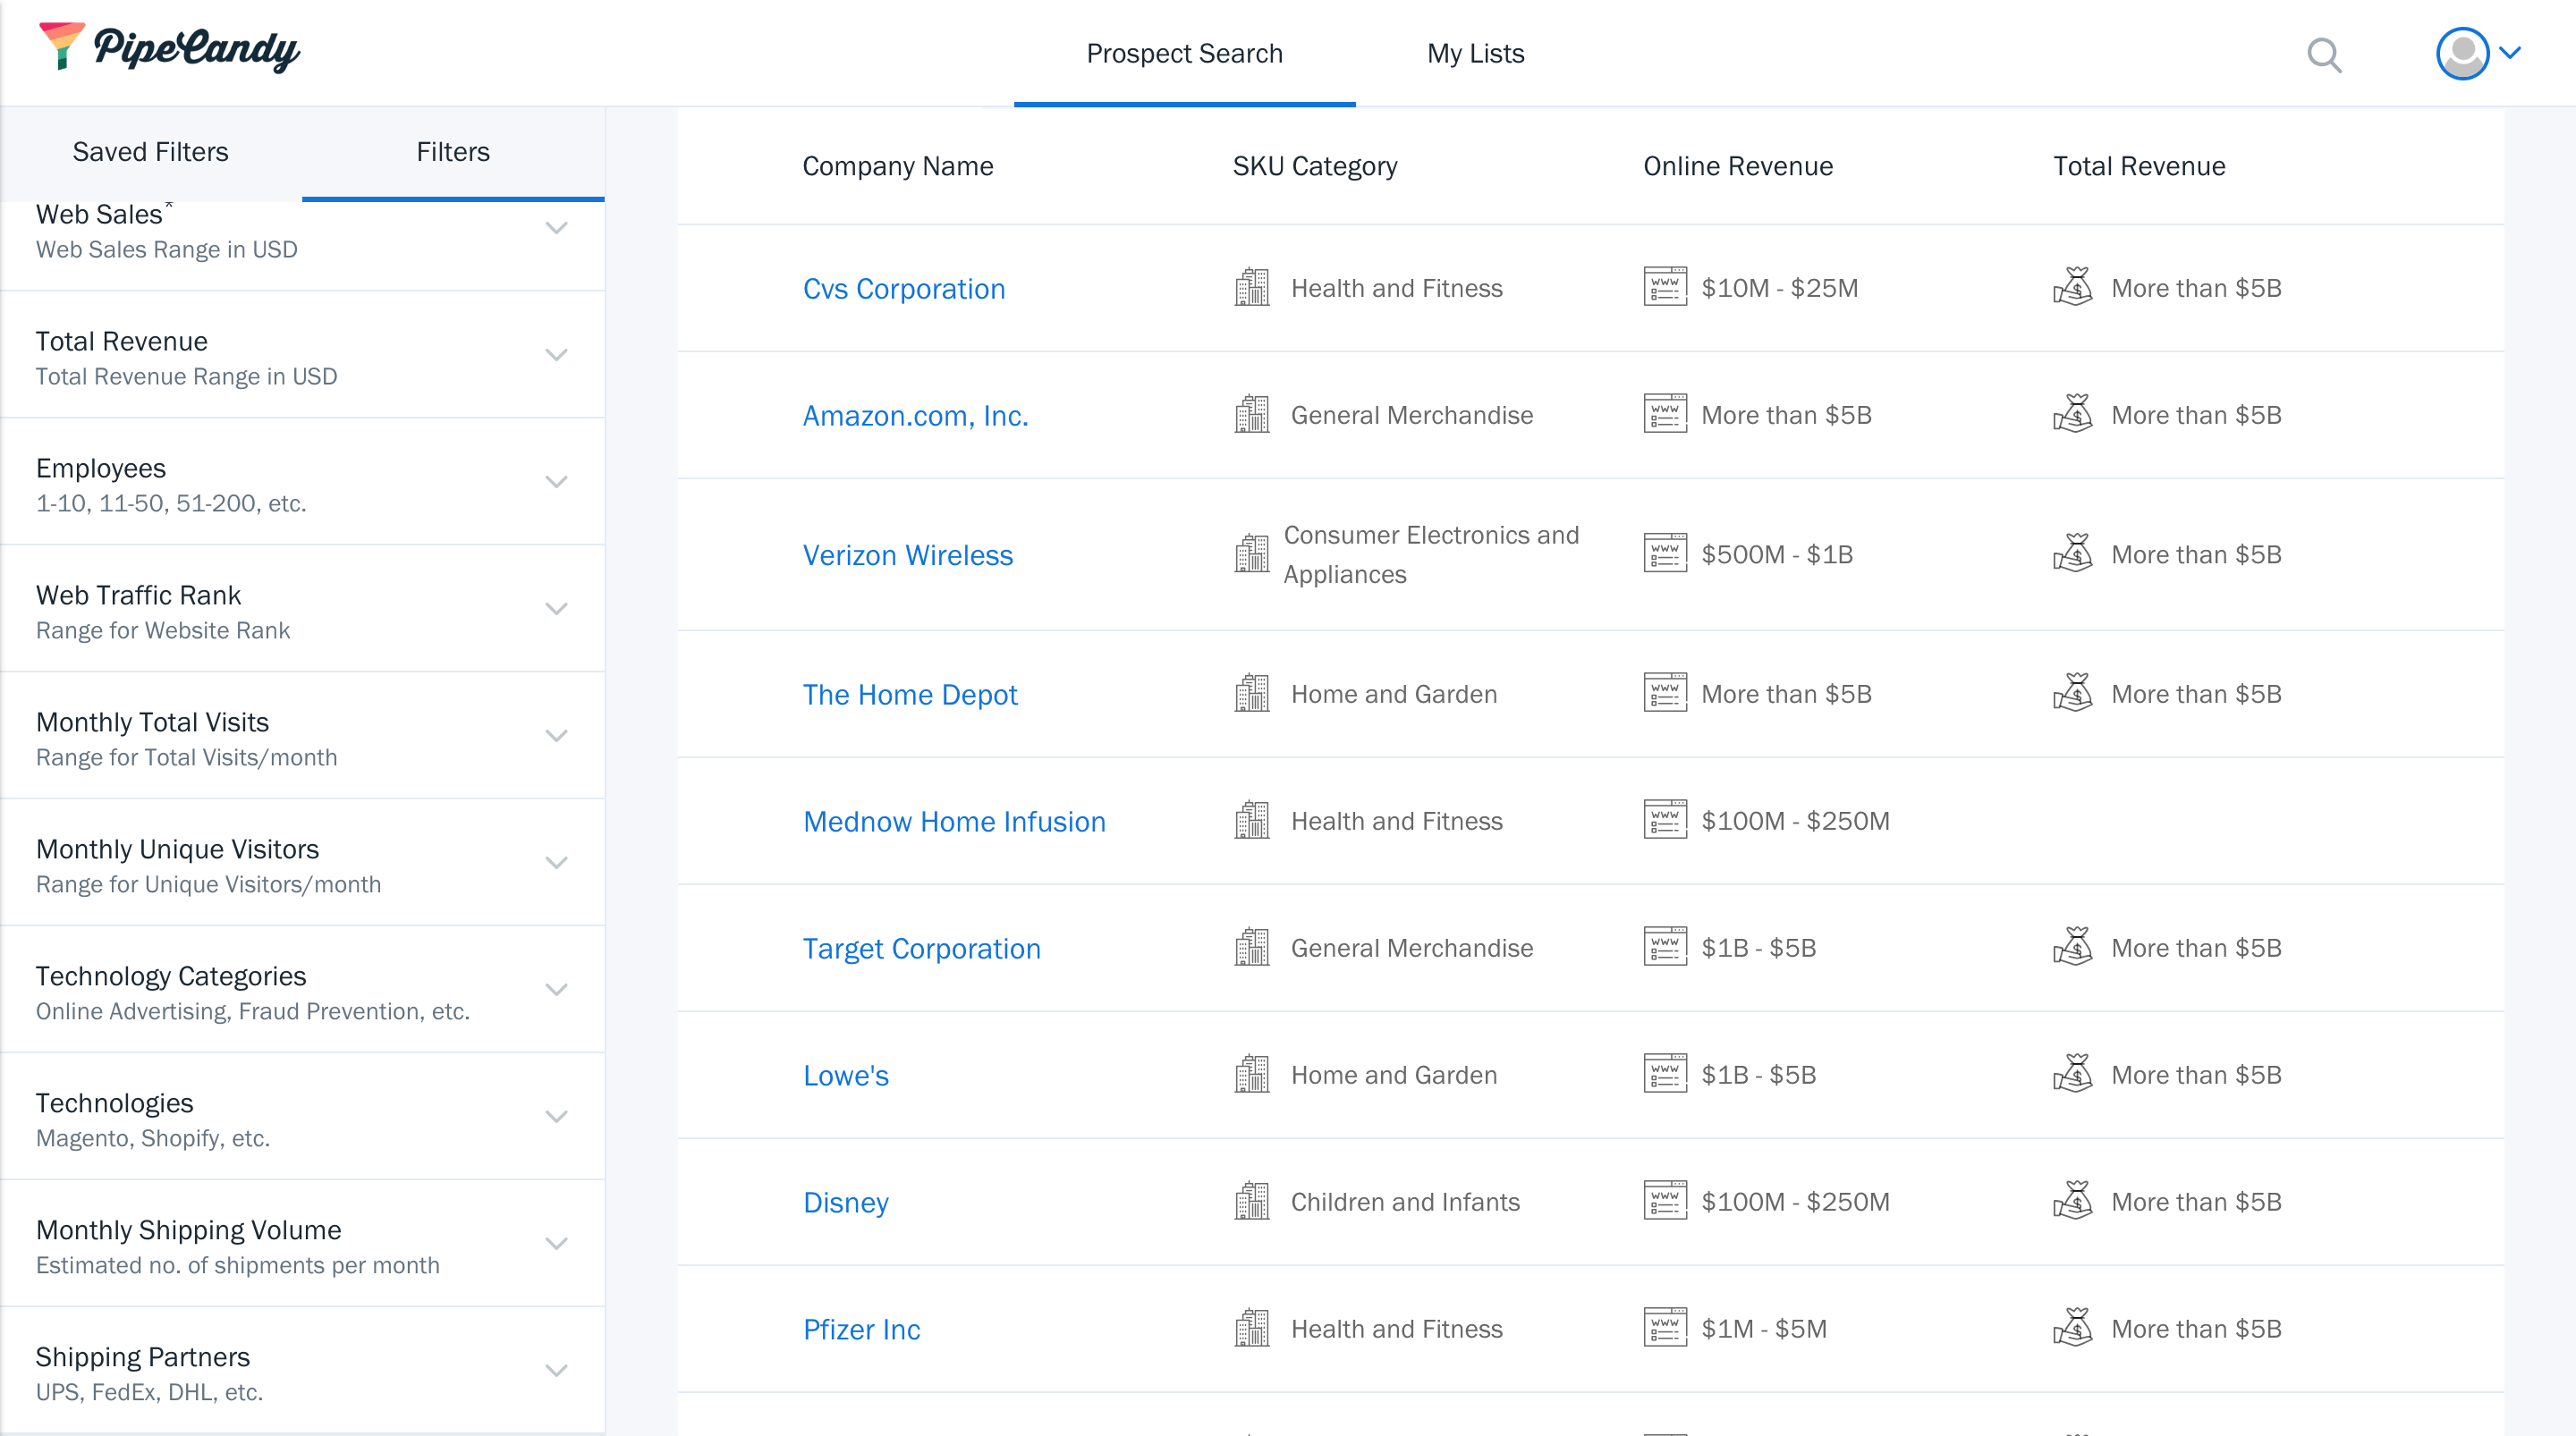 Boost your eCommerce efforts with PipeCandy's filtered search, comprehensively scored statistics, and more.
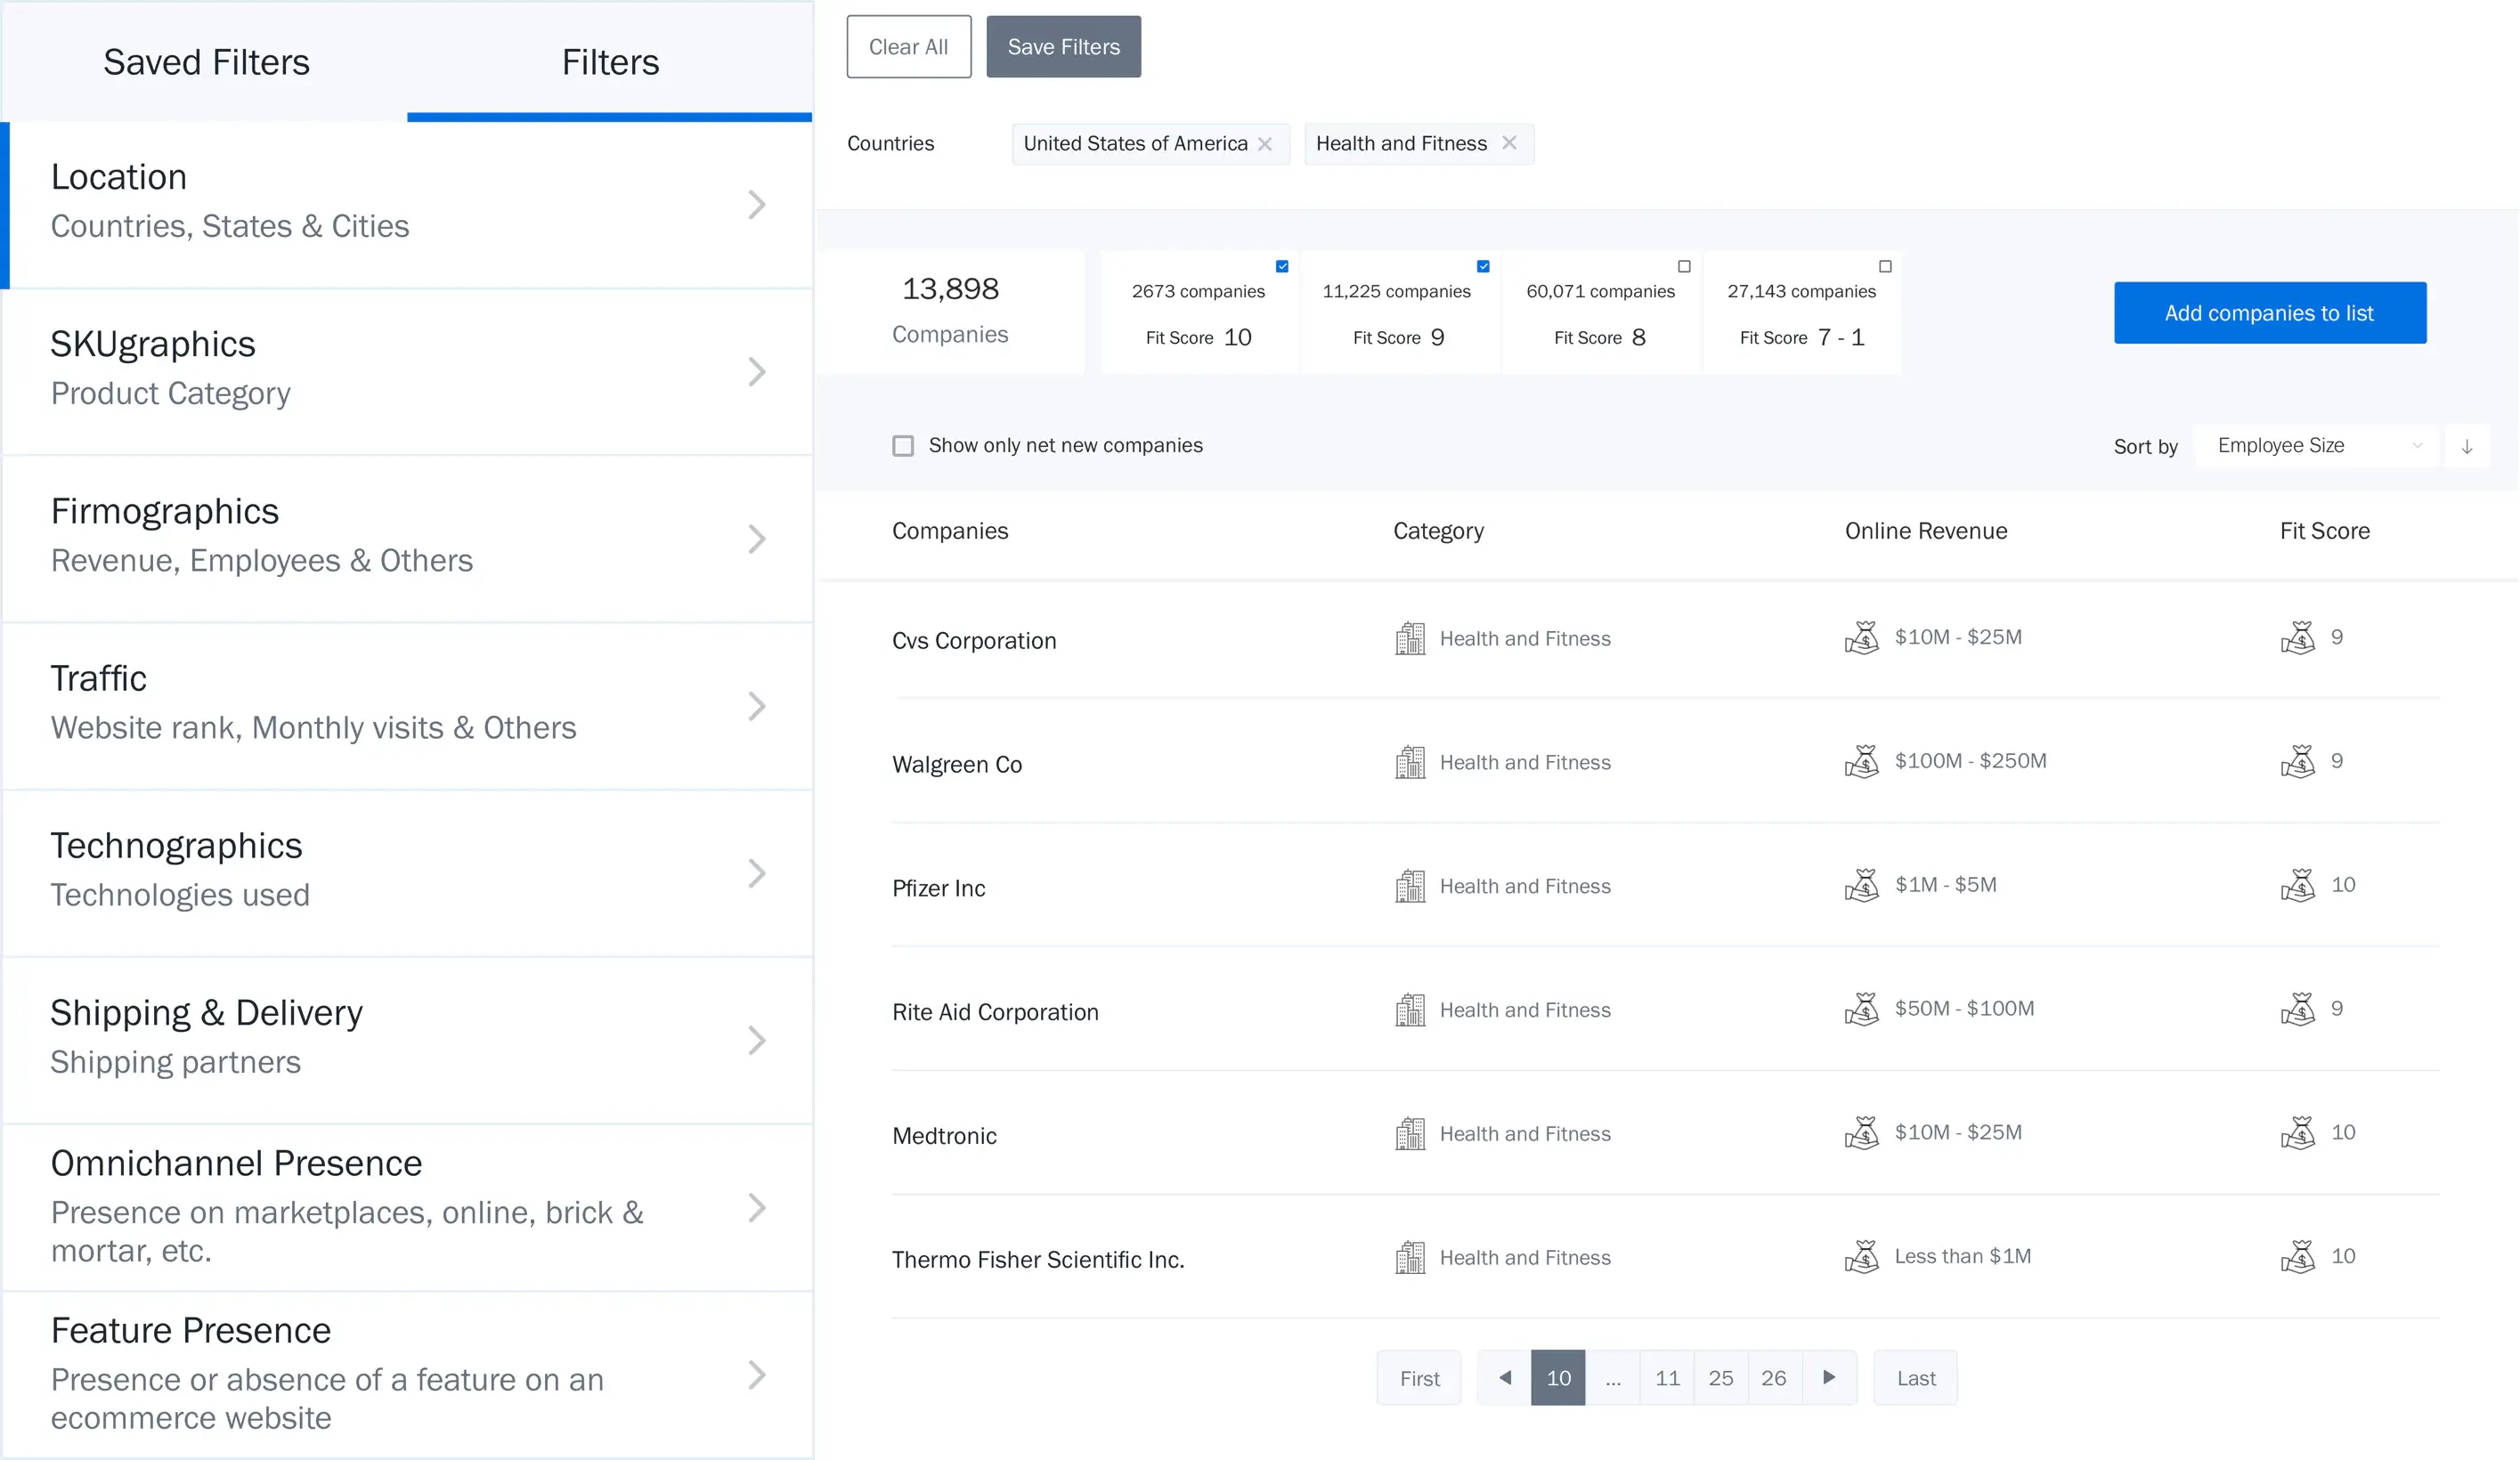 Effortlessly learn how companies stack up against each other with PipeCandy.
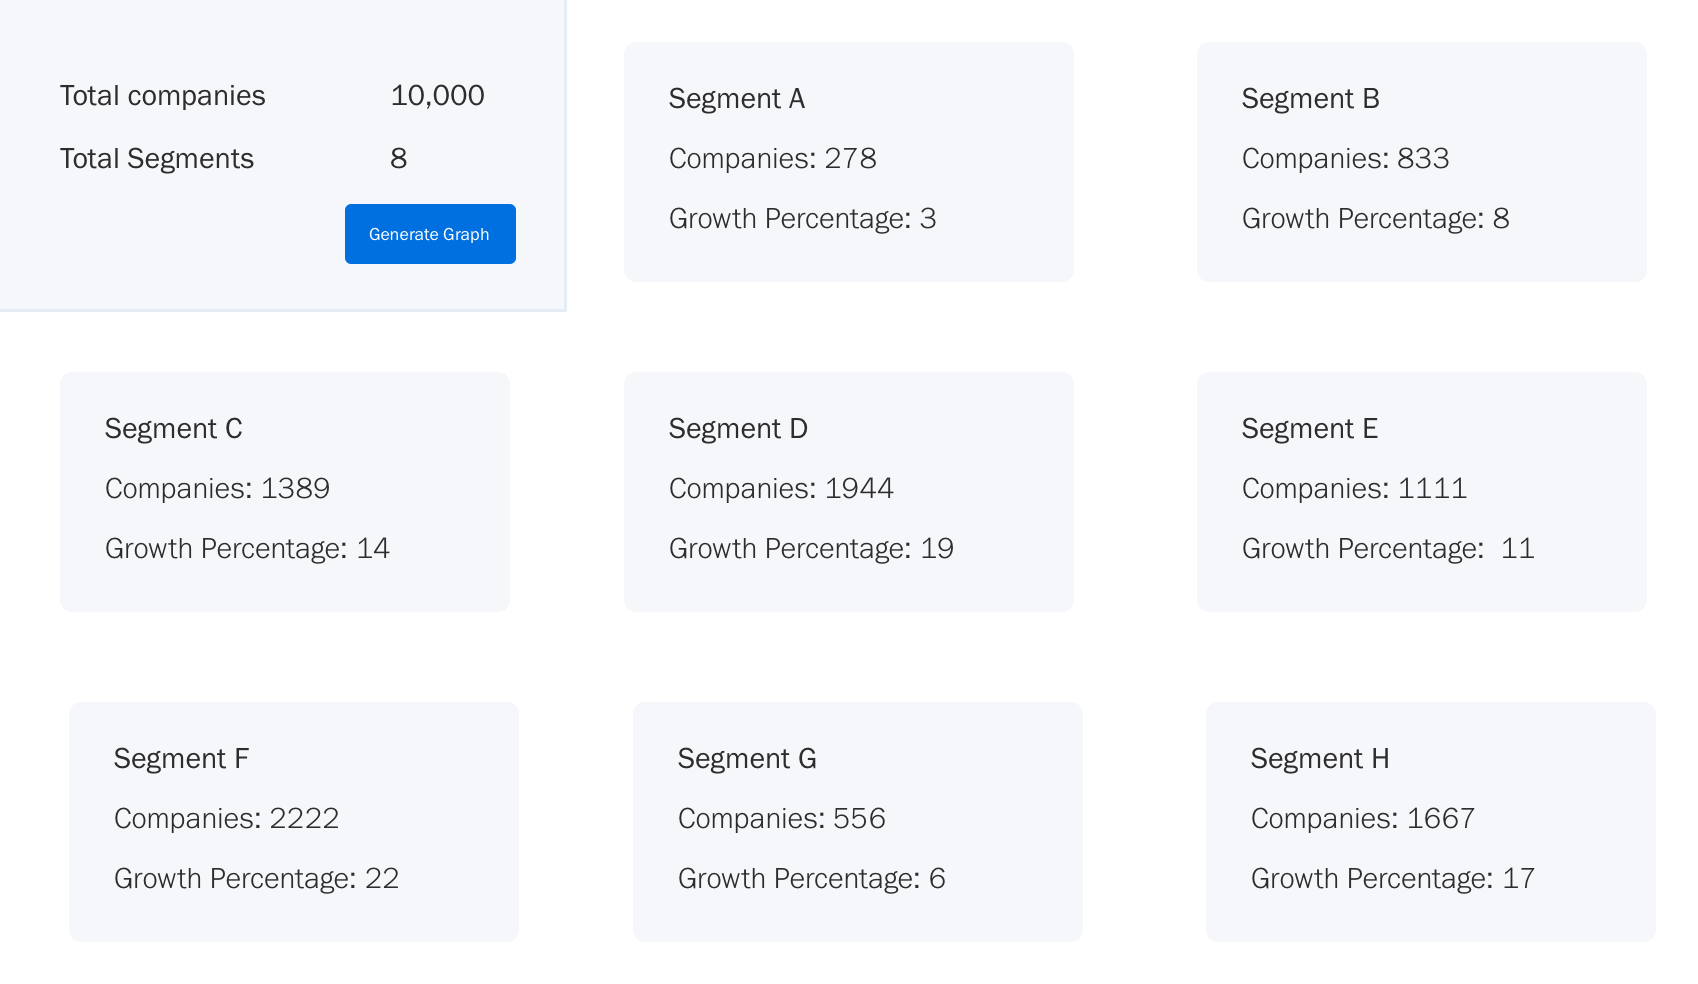 Monitor a company's quick or slow growth and more with PipeCandy.
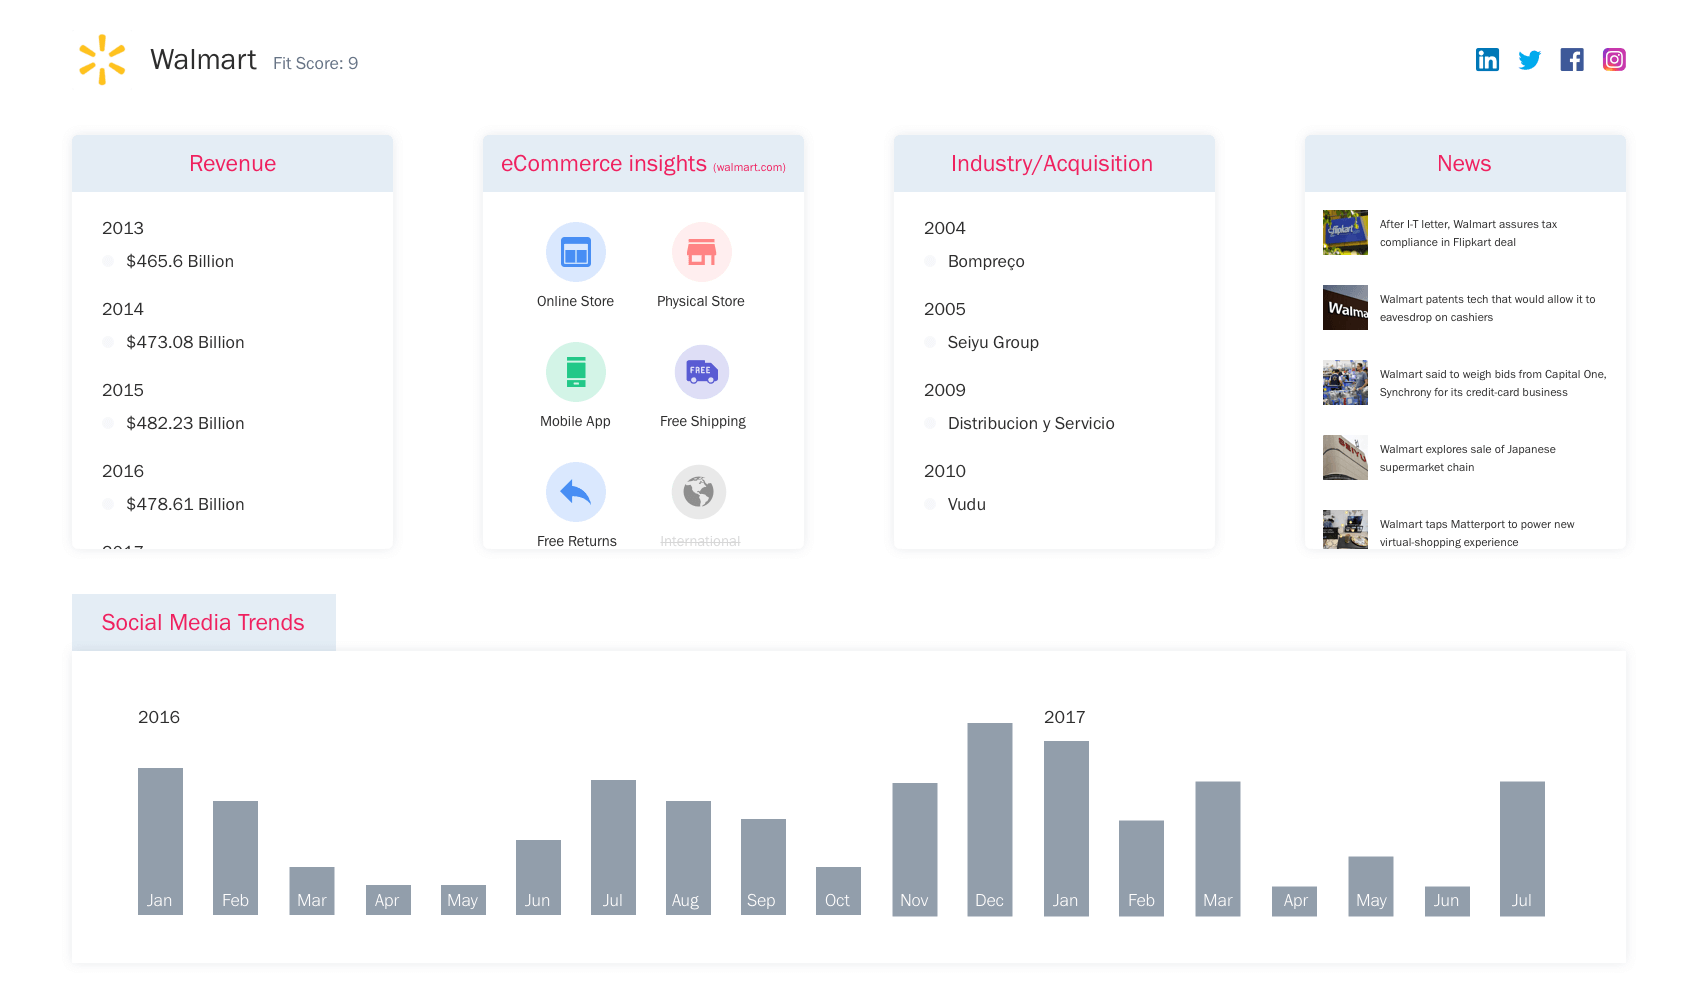 Confidently study everything you need to know about a company with PipeCandy.
 Uniquely view your gathered intelligence with OceanFrogs!
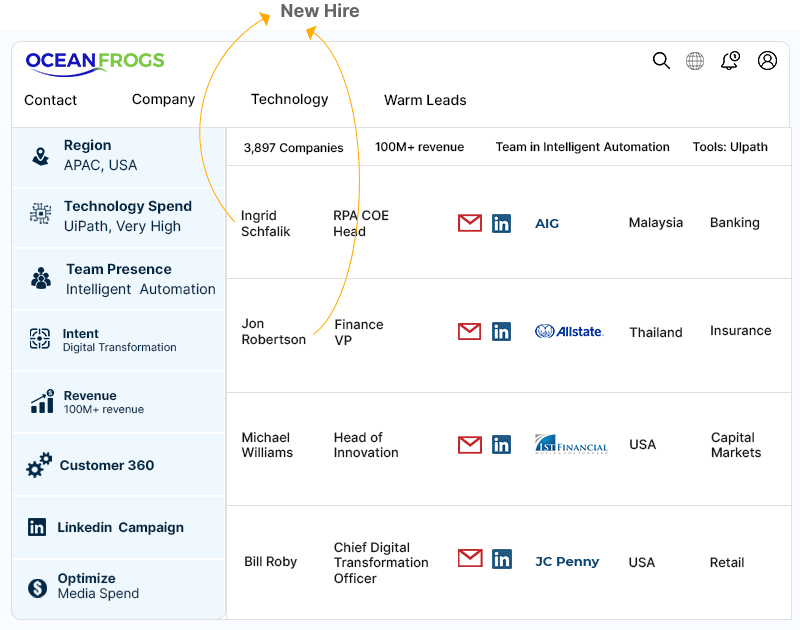 Track companies with new hires or looking for hires and never miss lead-generating opportunities with OceanFrogs.
 Easily stay updated on the competition with OceanFrogs.
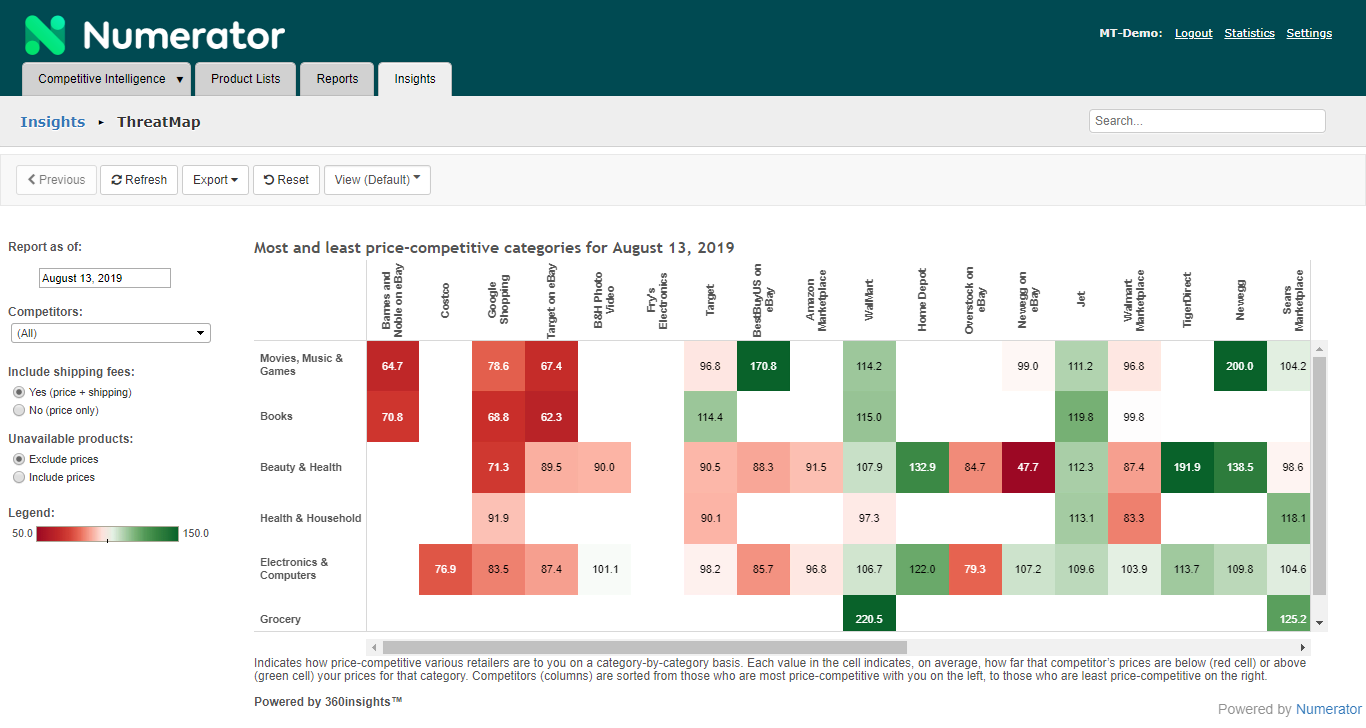 Enjoy detailed market intelligence like never before using Numerator Insights.
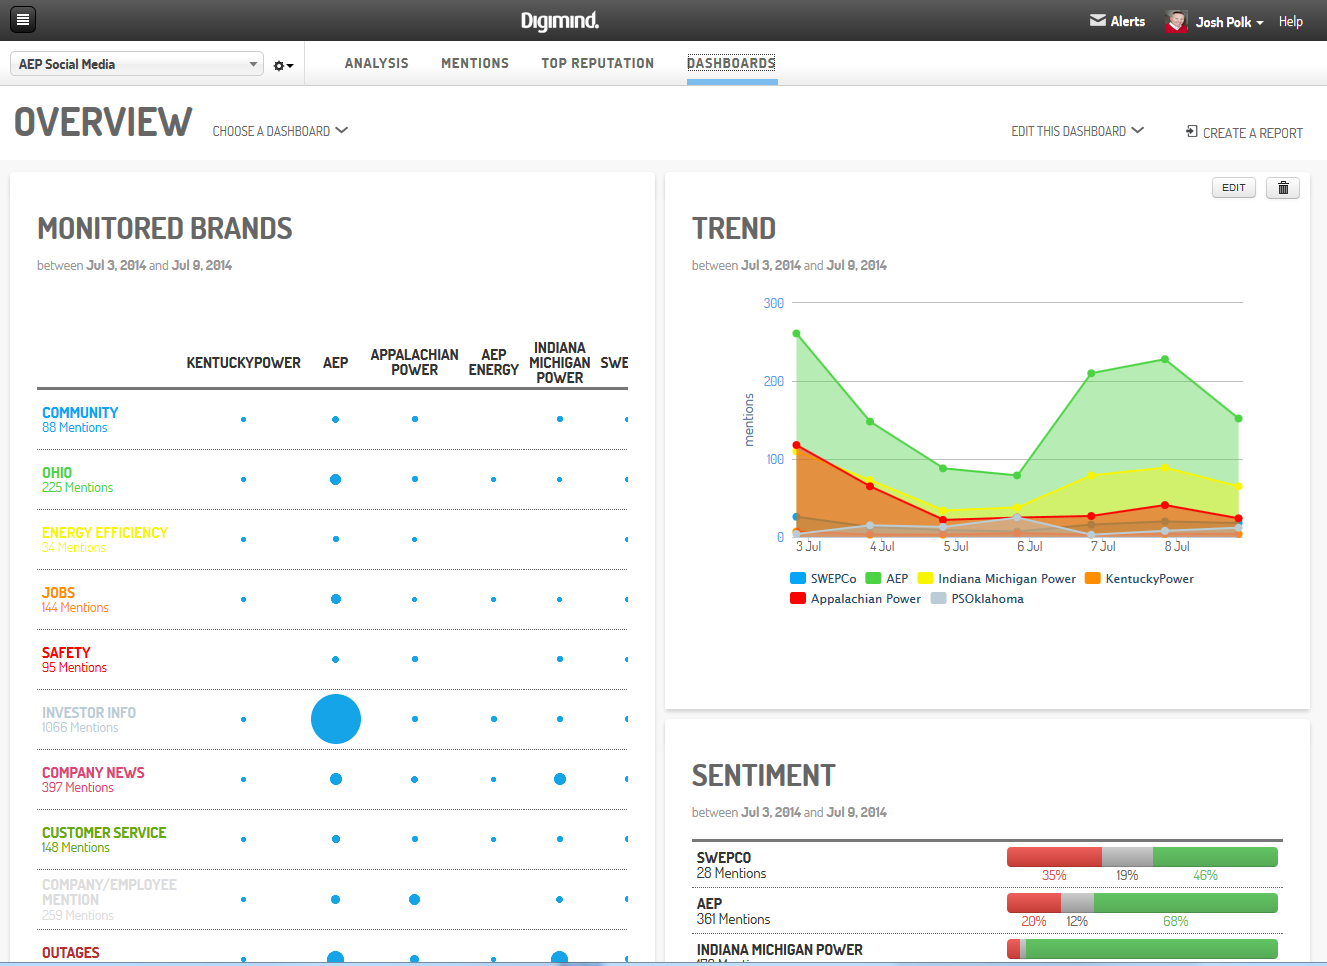 Monitor brands by tracking relevant news, creating reports, and socially listening to their customers with Digimind Intelligence.
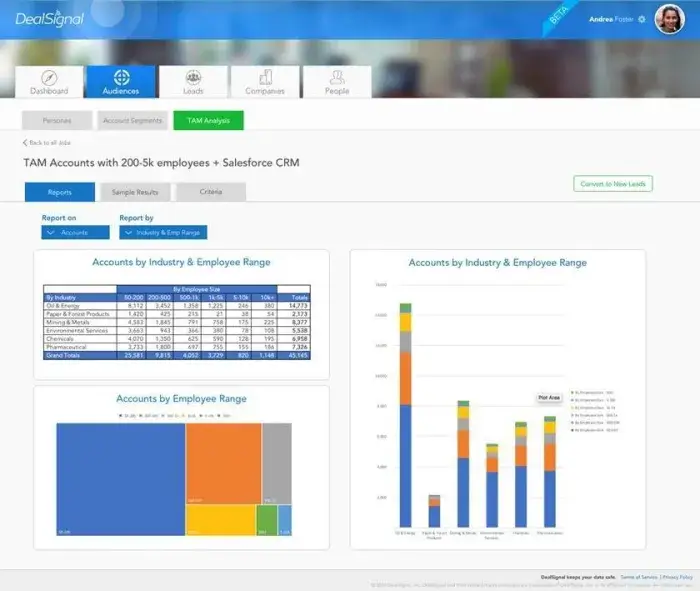 Level up your market intelligence efforts by focusing on generating leads through DealSignal.
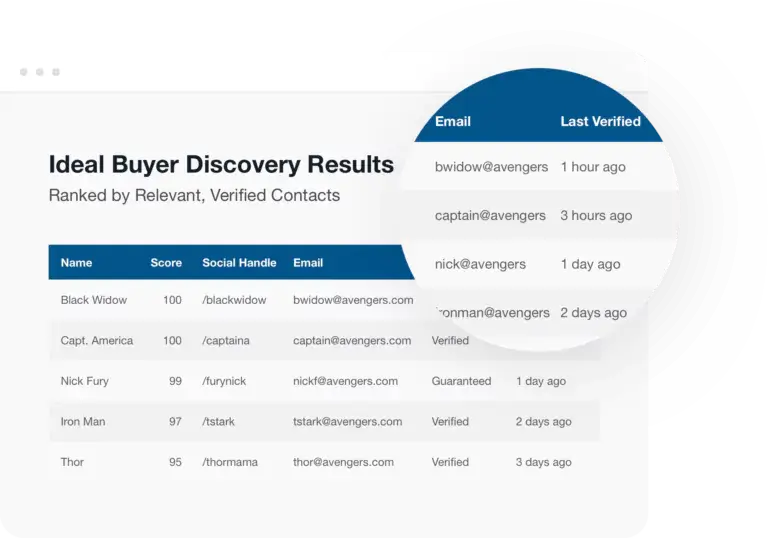 Easily discover your ideal customers through DealSignal.
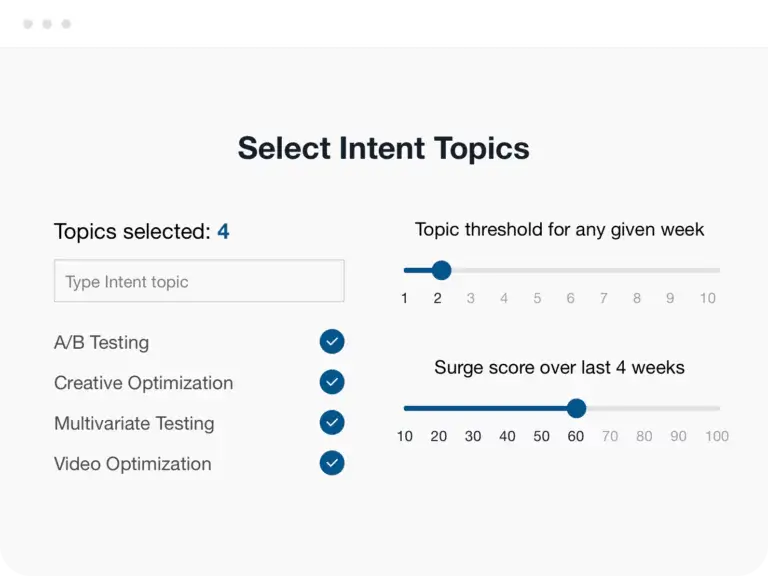 Categorize the market you're researching using different topics and utilize valuable insights with DealSignal.
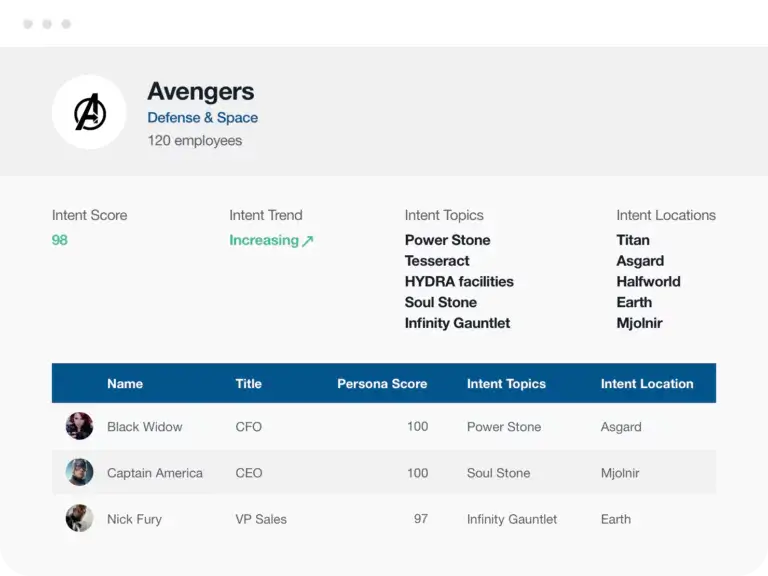 Take advantage of DealSignal's account-based marketing approach to gathering market intelligence.
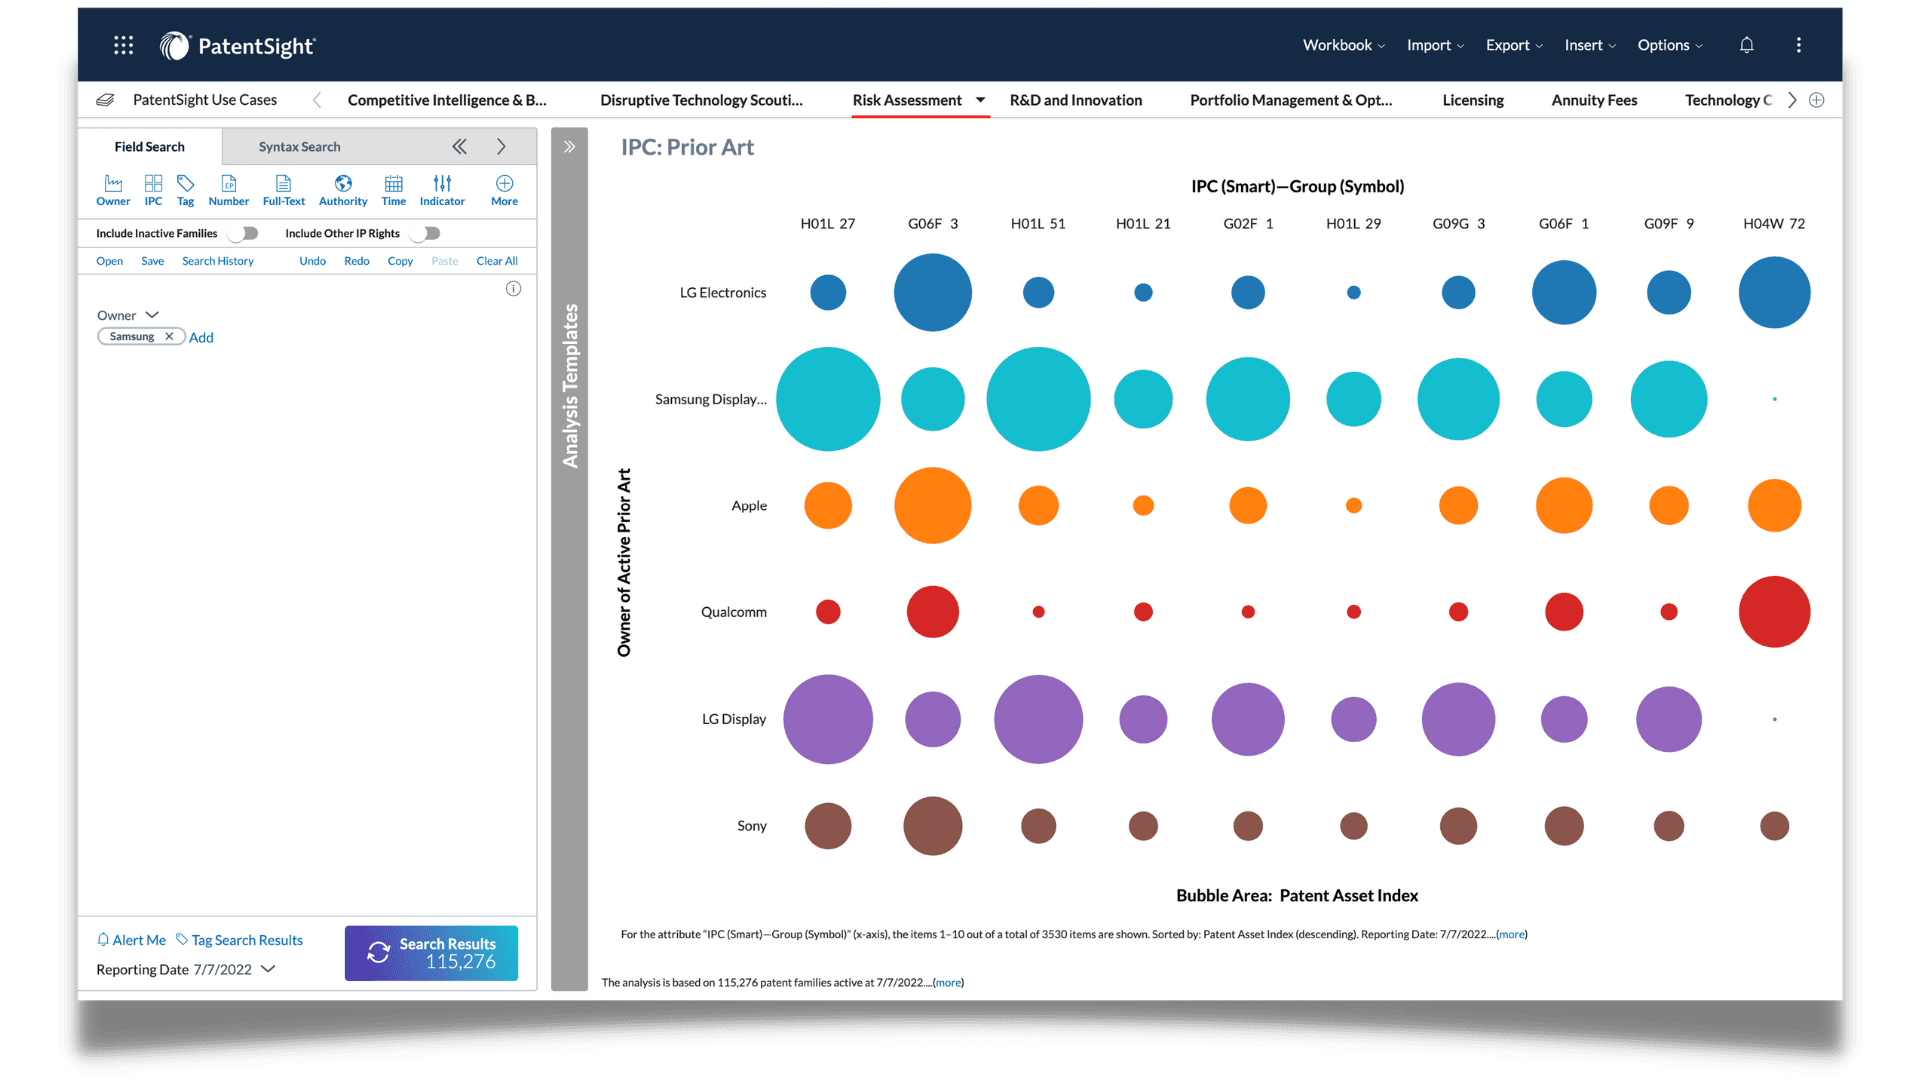 Easily access competitive intelligence, assess risks, and manage or view portfolios with Nexis.
 Conveniently access everything you need for market intelligence with MarketSight.
 Enjoy different market intelligence tools and level up your efforts with Orbis!
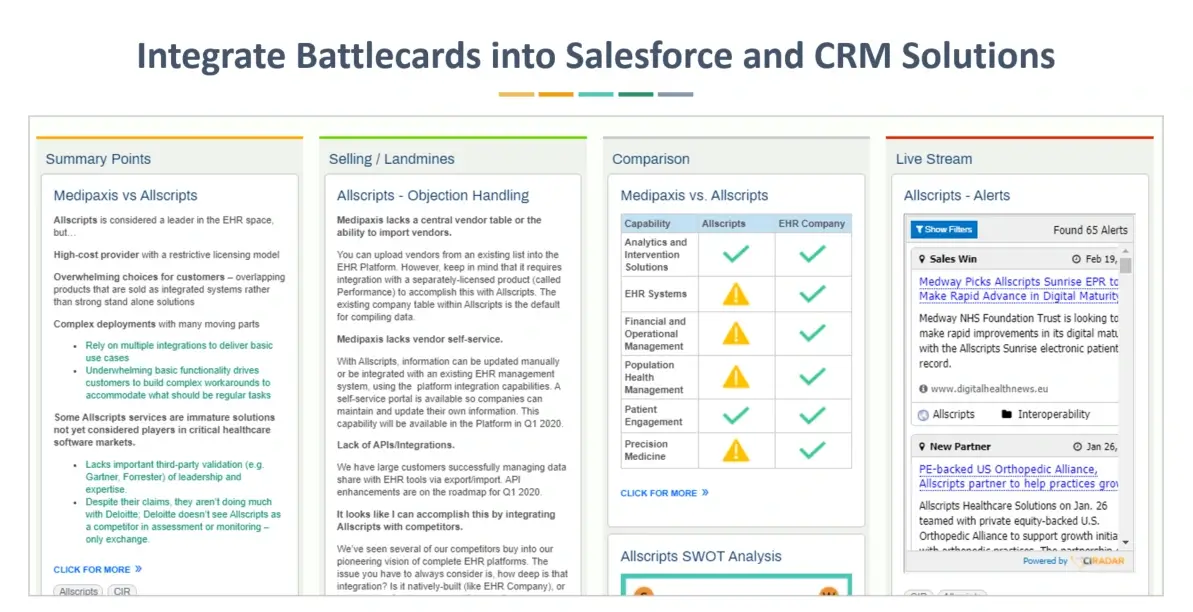 Closely watch your competition and even learn their secrets with CI Radar!
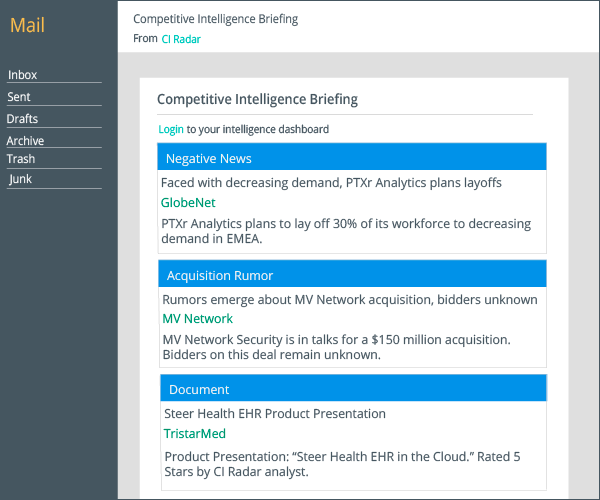 Gain valuable financial insights through CI Radar's intelligent analytics.
 Easily enrich data gathered from companies with CI Radar.
 Effortlessly track companies, their locations, and lead data with Arbit.
 Find more than just company data with ReportLinker – see how each topic correlates with another, too!
 Narrow your searches accordingly with ReportLinker!
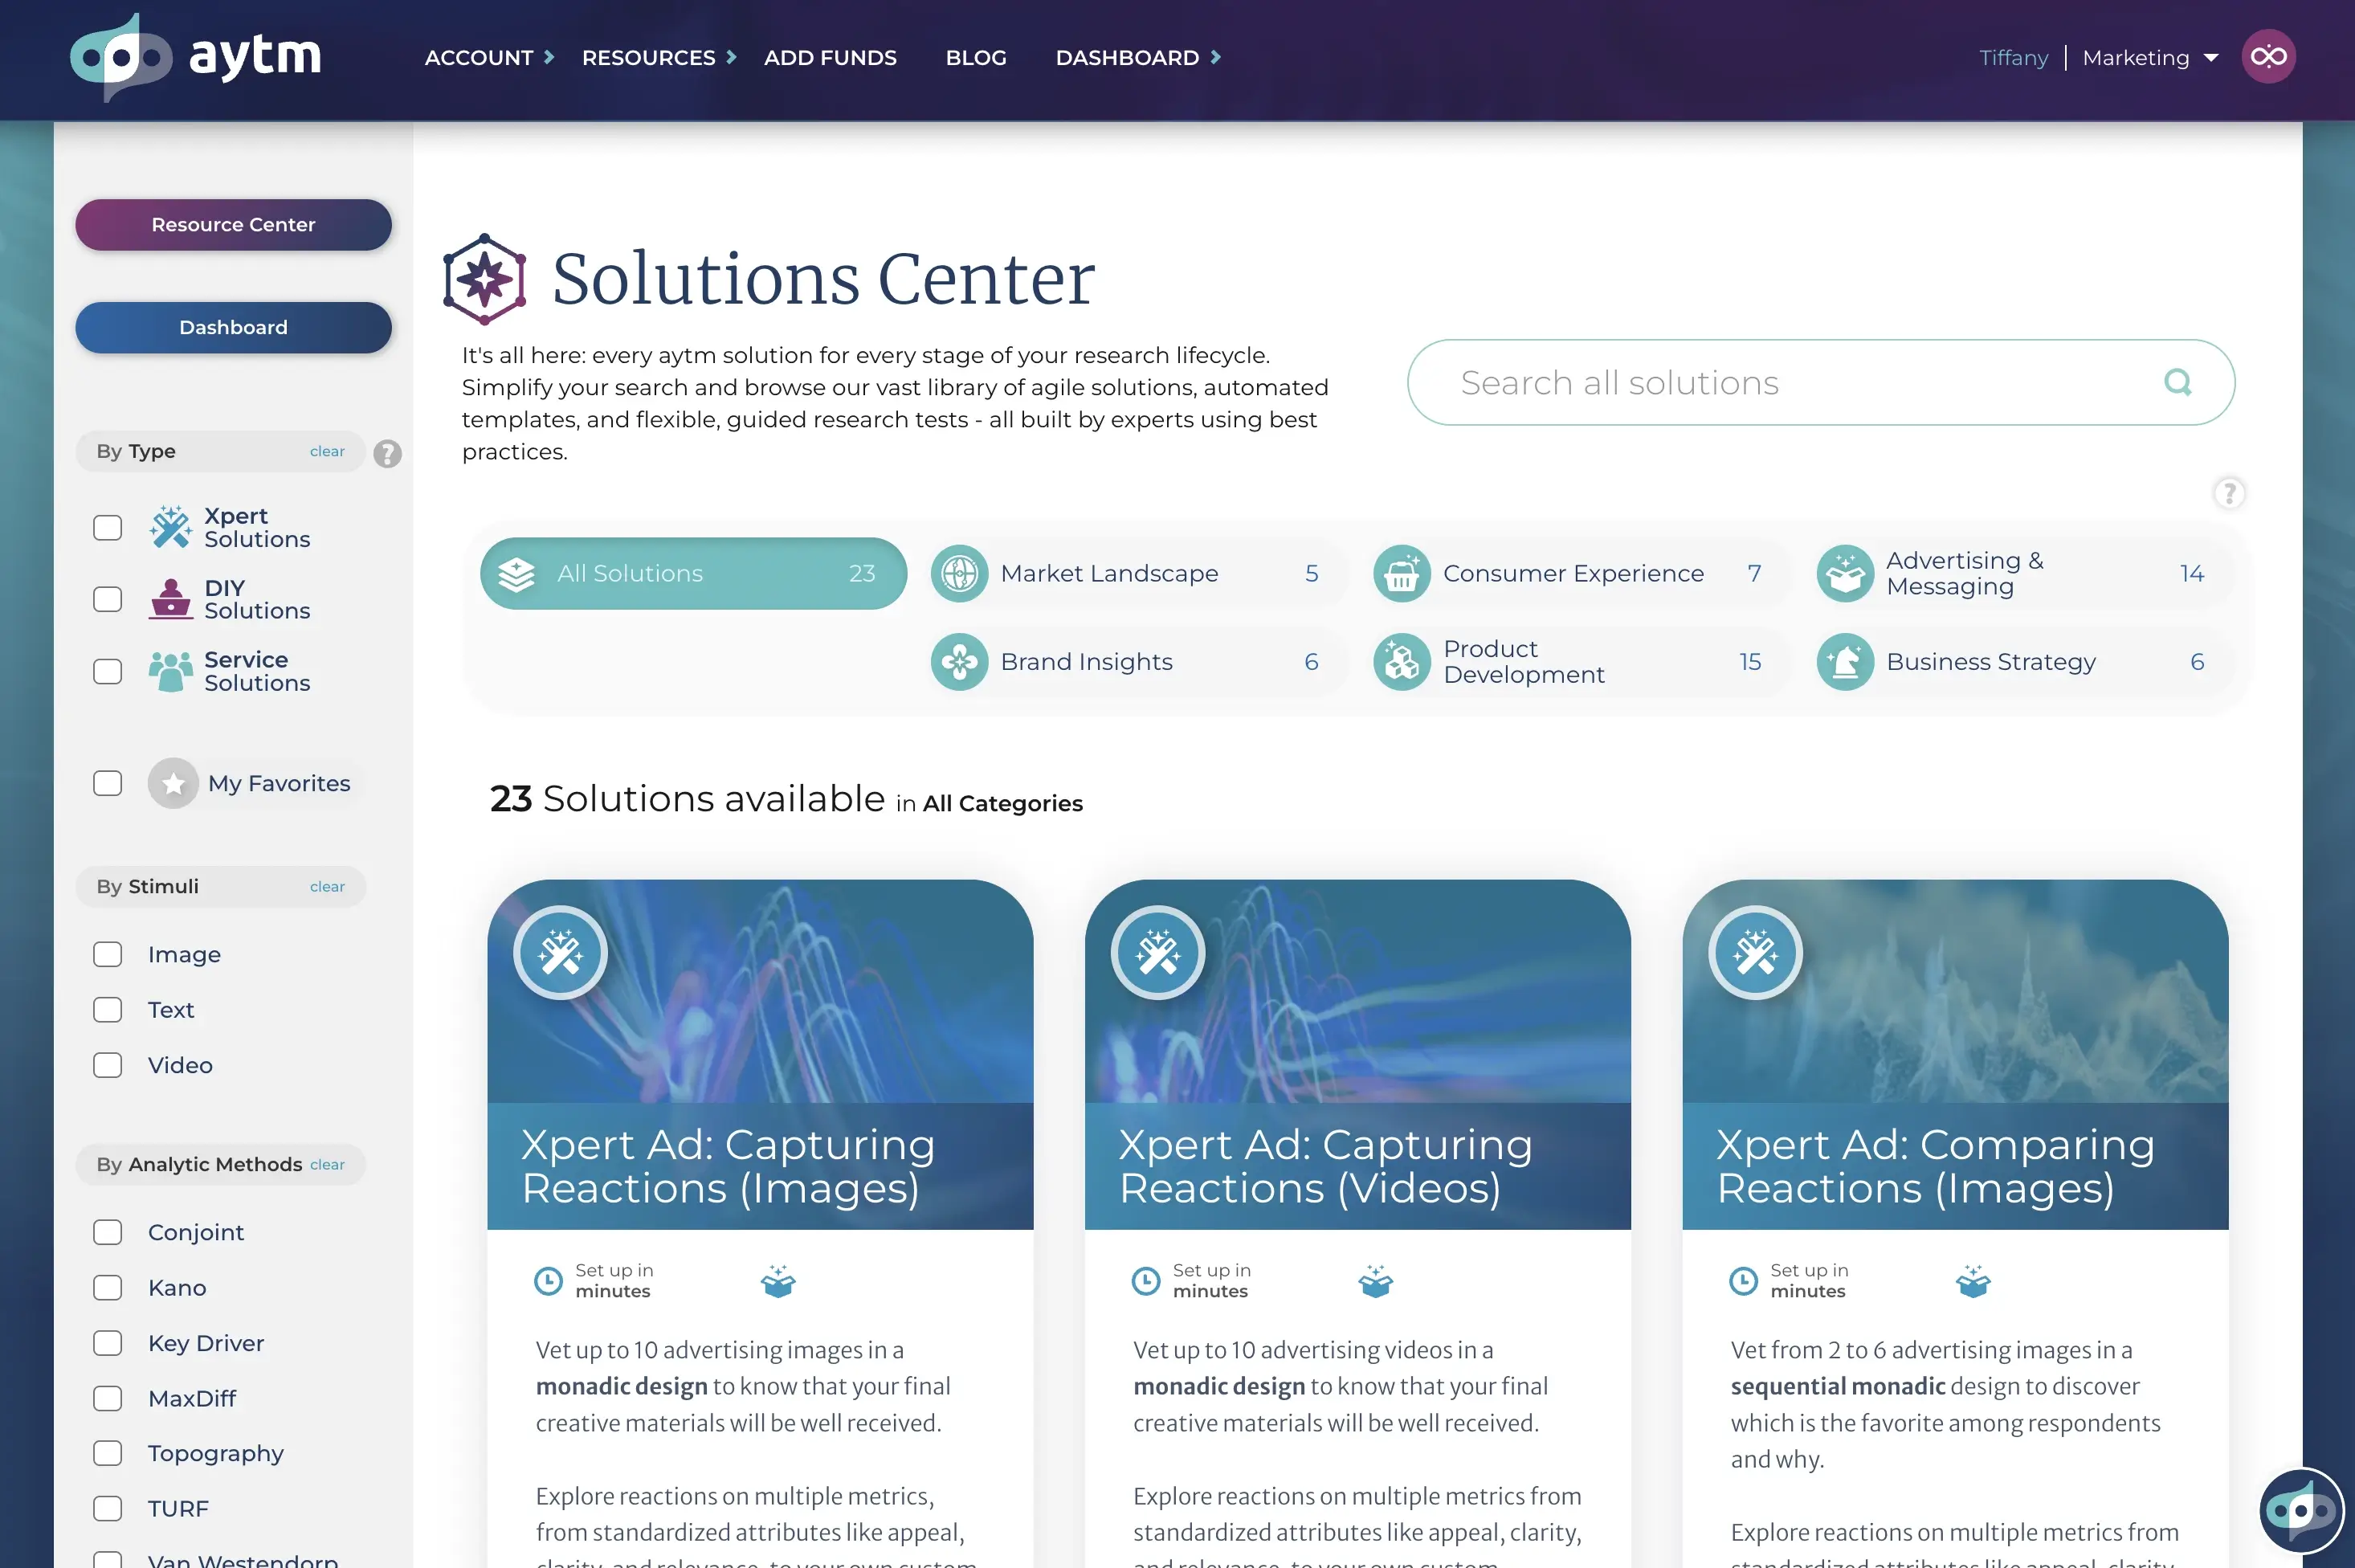 Create surveys, collect data, monitor competitors through a helpful feed, and do some advanced analytics with AYTM.
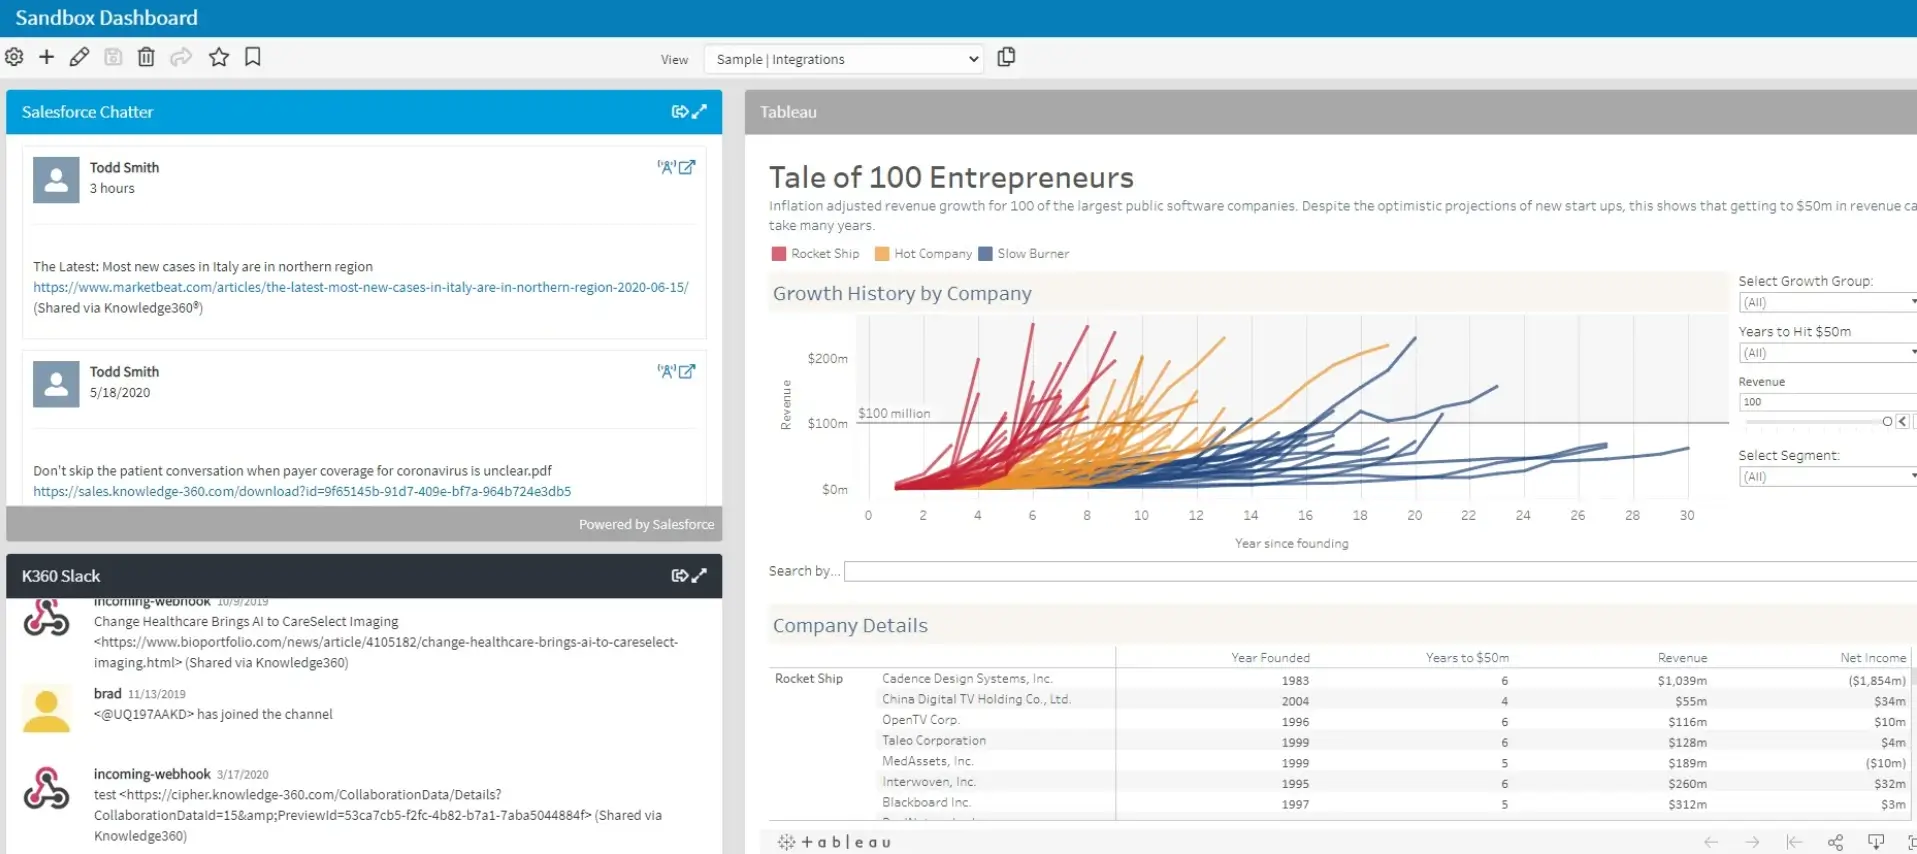 Utilize AI to identify trends and gather valuable data through Knowledge360.
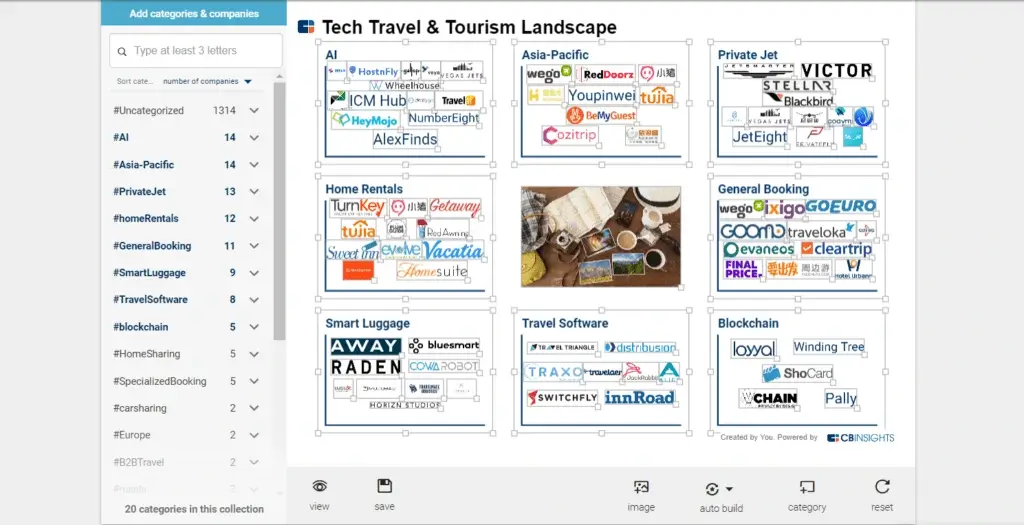 Monitor, collect, organize, and interpret market data with ease using CB Insights.
 Automatically collect and organize data with Intelligence2day!